Our Parent Company Offers International Property Loans in 15 Countries!

International Property Loans

Here are our 3 types of real estate financing solutions.

1. International Residential

In these countries, we offer onshore financing options. Our value-added is our relationships with local in-country banks, which we have developed over many years and would be hard for an international borrower to access.

Our partners are traditional banks, regional banks, wholesale lenders, and private banks, to name a few. Depending on the country, the minimum loan amount is $500,000 ($150,000 in the U.S. and Thailand).

In the U.S., our service is through our wholly-owned subsidiary, America Mortgages.

Available in these countries:

The AmericasEuropeMENAAsia
USAUKDubaiSingapore
CanadaFranceHong Kong
MexicoSpainJapan
PortugalThailand
ItalyAustralia

2. Global Bridge Lending 

This has been by far our most popular financing request this year, especially since traditional bank lending has been curtailed globally and the need for liquidity is required. These loans are normally first-lien, 1-3 years in tenure, and use the value of the underlying asset to qualify. Loan amounts range between $1-100M.

Here the value proposition is fast funding times, high loan-to-value, and flexibility. Typical use of proceeds are: to purchase more property, make personal investments, improve cash flow, make debt repayment, refurbishment, and cash out before sale, to name a few.

Available in these countries:

The AmericasEuropeMENAAsia
USAUKN/ASingapore
CanadaFranceHong Kong
SpainThailand
PortugalPhilippines
ItalyAustralia

3. Structured Real Estate Credit

These are larger, more complicated structures, often involving multiple levels of the credit stack. The minimum loan amount is $50M (lower on a case-by-case basis). Typical use of proceeds are: acquisition financing, last-mile development financing, construction loan, special situations, and distressed opportunities, to name a few.

Available in these countries:

The AmericasEuropeMENAAsia
USAUKDubaiSingapore
CanadaFranceHong Kong
SpainThailand
PortugalAustralia
Italy

Our corporate material:

Global Mortgage GroupAmerica Mortgages
GMG Corporate ProfileAM Corporate Profile
International Loan ProgramsForeign National Loan Programs
Global Specialty LendingU.S. Expat Loan Programs 
Global Bridging LoansHigh Net Worth Loan Programs

Please feel free to contact me directly if you have any questions relating to real estate financing anywhere in the world.

Donald Klip
Co-Founder
Global Mortgage Group & America Mortgages

[email protected]

5 Reasons Why U.S. Housing Prices will not Crash but Surprise us!

1. Lack of investment by homebuilders

According to data from the U.S. Census Bureau, fewer homes were built in the U.S. in the 10 years following the 2008 financial crisis than in any decade since the 1960s.

From 2010 to 2019, a total of 6.8 million new privately-owned housing units were completed in the U.S., significantly lower than the 9.7 million units completed in the 2000s and the 8.6 million units completed in the 1990s.

A major reason for the drop in new housing construction following the 2008 financial crisis was partly due to the housing market crash, which led to a decline in demand for new homes and tighter lending standards (Dodd-Frank).

2. Higher input costs

Additionally, builders faced various challenges during this period, including higher land and labor costs, regulatory hurdles, and a shortage of skilled workers for construction.

These issues are only more pronounced now with higher wages, higher input prices such as lumber, concrete, etc., and of course, financing costs as of last year!

3. Massive lack of housing supply to meet demand

Last year, Freddie Mac published an article, “Housing Supply: A Growing Deficit,” noting as of the fourth quarter of 2020, the U.S. had a housing supply deficit of 3.8 million units.”

Meanwhile, the National Association of Realtors projects that the housing deficit is closer to 6.8 million homes.

Lastly, a report published by the Fed last year, “Volatility in Home Sales and Prices: Supply or Demand?” find that a 30% increase in the monthly number of homes coming onto the market would have been necessary to keep up with the pandemic-era surge in demand​.

4. TikTokers need more space at home

However, there is a new dynamic that has arisen over the past 3 years, which is how labor is defined and its impact on housing. Many workers are now choosing to work from home, and also, the younger entrants into the labor force are now earning income from alternative methods, all requiring some “extra space” at home and not an office to go to (TikTok, Amazon sales, Crypto trading, etc.) – this is all very supportive of housing demand.

5. Stability

The stability of the U.S. housing market cannot be underestimated. Post-COVID, when mortgage rates were lowered to historically low levels, most homeowners took the opportunity to refinance their homes to take advantage of the interest rate savings. Fast forward to today, 50% of all mortgages outstanding are under 4%, fixed for 30 years​; 40% of all homes are owned free and clear, and nearly 100% of all borrowers have mortgages lower than the current rate!

Will we see a crash? NO!

We feel given the structure of the supply-demand landscape, there is no impending crash, but we feel the market will be supported faster than expected.

In summary, whether you say we are 4M units short, 6M units short, or 30% short – we are short, making this a great opportunity to start building your U.S. rental portfolio, given rental income and yields will continue to rise.

Why Rents Increase in the “Bizarro World”

The “Bizarro World” references Bizarro Superman, a supervillain who lives in a world where everything is opposite. Here’s a great explanation from the TV show Seinfeld. 

This reminds me of the world we live in now; mortgage rates double in 10 months, and yet, rental yields continue to increase double digits, year-on-year. 

I have been telling our clients over the past few months that it is a great time to be owning a home in the U.S. for investment income. Most of us have lived through a few economic cycles, and for most of my career, 30-year fixed rates were between 6-7%, which is when I got my first mortgage in 2006, similar to where rates are now.  

However, back then, you owned homes almost as leveraged equity, not like what it’s meant to be, more similar to a bond. 

When academics say real estate is an inflation hedge, that is a peculiar concept since we have not really seen any inflation since the 70s, so not many of us know what that means in real life.    

Till now….

This world is very different. Good or Bad, the fact is that there are significantly more people who need housing, millennials are unable to afford homes, and the rising rates have squeezed out the marginal buyer, and all of the above need to live somewhere. 

My colleagues hear me say this ad nauseam, 

“We will be in a world where 30-year fixed-rate mortgages are 7%, but rental yields are 10-15% very soon”.

I will try to explain why in this report. 

A few days ago, on October 13th, Redfin reported that the Median U.S. Asking Rent rose 9% year-over-year in September to $2,002, the slowest growth since August 2021 and the first single-digit increase in a year. Sure the article makes it sound bearish.

Wait a minute? (sound of car screeching on the pavement).

Mortgage rates have doubled since the beginning of the year, and yet rents are still rising 9% a year. (As recent as May, rents rose +18% year on year!)

While visually, it does look like rents are falling, but that was from an outlier peak of 18% in May….my personal view is anything that has growth in this world is POSITIVE!

In some cities like Oklahoma City and Pittsburgh, rents rose by more than 20% year-on-year (not a typo). More below. 

THE PROBLEM – HOUSING SHORTAGE

A housing shortage is not something you can really see. We hear it on the news or read it in the papers, and we think…how can that possibly be an issue. 

Can’t homebuilders just build more homes? 

The NABM/Wells Fargo Housing Market Index dropped three points to 46 in September, the lowest reading since May 2014!  

Meanwhile, “Application to Build” declined to 1.52M units, the lowest since 2020. 

Number of Building Permits (SAAR)

One could also conclude with higher borrowing costs, homebuilders are discouraged from starting new projects, which is not helping the undersupply situation. 

Another aspect of this is the financial incentive.   

Like many other issues in the U.S. economy, there has been a focus on shareholder returns, dividends, share buybacks, etc., and hence the underinvestment in housing development since the Financial Crisis in 2008.  

In fact, fewer homes were built in the U.S. in the 10 years following the 2008 financial crisis than in any decade since the 1960s! Think about that for a moment! 

In the normal world, high mortgage rates tend to bring down values, and of course, there are some parts of the U.S. that are seeing a relatively faster decline in home prices, like San Francisco. I would argue that is city-specific, as the local economy hollows out and the homeless situation and cost of living is untenable for most. 

Across the nation, there are indeed fewer sales and more price cuts on listed homes. 

However, in this “Everything-is-weird” economy, the doubling in mortgage rates hasn’t caused home prices to fall as much as you would think, all things equal.   

In fact, I really don’t think we are going to see any substantial collapse in home prices in the coming years because many owners bought when mortgage rates were low and can simply stay put through this phase of the economic cycle. 

Also, there was less speculation, and investors put more equity in the properties during a time of tight supply. This will keep many families locked out of homeownership and forced to rent.

Here are some mind-blowing data points: Around half of all mortgages outstanding are under 4% fixed for 30 years, and about 40% of all homes are owned free and clear. Think about that for a moment!

Last month, Philly Fed President Patrick Harker discussed his recent research report with most major news outlets, “Unpacking Shelter Inflation”, September 2022, that the housing shortage is a key inflation driver. Read: “…housing shortage…”

In another research report by the Fed, “Volatility in Home Sales and Prices: Supply or Demand?”, Anenberg and Ringo, June 2022, write:

“We find that a 30% increase in the monthly number of homes coming onto the market would have been necessary to keep up with the pandemic-era surge in demand. Since new construction typically accounts for about 15% of supply, our estimates imply that new construction would have had to increase by roughly 300% to absorb the pandemic-era surge in demand. This is a very large, unrealistic impulse to housing supply in the short-run, suggesting that policies aimed at reducing bottlenecks to new construction would have done little to cool the housing market during Covid-19.”

Read again: “…new construction would have had to increase by roughly 300% to absorb the pandemic-era surge in demand.”

Here is yet another report, this time by Freddie Mac. “Housing Supply: A Growing Deficit”, Kater, May 2022. I give a little more weight to Freddie Mac since they are actually buying the loans. Their thesis is that:

“As of the fourth quarter of 2020, the U.S. had a housing supply deficit of 3.8 million units. These 3.8 million units are needed not only to meet the demand from the growing number of households but also to maintain a target vacancy rate of 13%. Between 2018 and 2020, the housing stock deficit increased by approximately 52%.”

Read yet again! “…U.S. housing supply deficit of 3.8 million units.”

I always take stuff like this with a grain of salt because academics look at things from a 10,000 ft altitude and through the lens of an Excel spreadsheet, but the gist is that every Think Tank in the world seems to claim there is a shortage of housing supply and since they have a few more tools (and PhDs) at their disposal for this that I do, I will take their conclusions at face value.  

Here is a neat graphic from The New York Times, The Housing Shortage Isn’t’ Just a Coastal Thing Anymore” Badger and Washington, July 2022.

The Housing Shortage has Spread to More Parts of the Country.

Source: Up for Growth analysis of U.S. Census Bureau and U.S. Department of Housing and Urban Development data. Shortage percentages reflect estimated housing units needed to meet demand as a share of existing housing units. Metros with a surplus have enough housing for existing residents.

Let’s look at recent city-specific rental prices:

Top 10 HIGHEST Year-on-year Change in Median Asking Rent (%) *

Top 10 LOWEST Year-on-year Change in Median Asking Rent (%) *

Top 10 HIGHEST Median Asking Rent *

Top 10 LOWEST Median Asking Rent *

* From Redfin News: “Rental Market Tracker: Rents are Growing Half as Fast as They Were 6 Months Ago,” by Lily Katz, October 13, 2022 Methodology – Redfin analyzed rent prices from Rent.com across the 50 largest U.S. metro areas. This analysis uses data from more than 20,000 apartment buildings across the country.It is important to note that the prices in this report reflect the current costs of new leases during each time period. In other words, the amount shown as the median rent is not the median of what all renters are paying but the median cost of apartments that were available for new renters during the report month. Currently, Redfin’s data from Rent.com includes only median rent at the metro level. Future reports will compare median rent prices at a more granular geographic level.

DEMAND IS DIFFERENT NOW

Single-person households accounted for 80% of the new household units that have formed since 2020. Think your one-man Crypto trader or Tik Tok marketer. Meanwhile, the number of Gen Z adults living alone almost doubled from January 2020 to early 2022 (sounds like a lot of COVID breakups), likely using the stimulus income to get started. The point here is that the way labour formation is defined now makes this current real estate cycle and how it interacts with the overall economy very different from past cycles.   

Another quirk of the world we live in is Video Conferencing. While we can imagine a world where we go back 5 days a week but in reality, my view is that how we work has changed forever and there are clear benefits for being able to Zoom. What this has done is artificially increased the living space needed (globally). That is to say, adding a corner or a room just for Zoom calls etc, driving up demand for overall living space.

SUMMARY

In summary, the makeup of the labour market, as well as the supply demand imbalances in real estate, are very supportive of higher rental prices and rental yields over the long term. 

As a non-resident buyer of U.S. real estate hoping to earn income, this is the perfect storm and has only happened BECAUSE rates are rising.    

We may see rates come down in the future where borrowers can easily refinance into a lower rate, but what if prices do not come down or there is a sudden price surge next year? These are all crystal ball-type guesses but what I want to leave with you in this report is that the lack of supply is a major long-term driver of higher rental yields, which is positive for any U.S. real estate investor.

U.S. real estate is considered a safe haven for many – low entry price point, no stamp duties, ease of gentrification, available tax deductions, USD income, ease of travel, quality of schooling, and the list goes on.  

If you have any questions about this report or about anything U.S. real estate or mortgage related, please feel free to reach out to me directly at: +65 9773 0273 or email me at [email protected].

“Ex-post, Ex-ante” + Family Office uses bridge loan to buy Retail/Office building

Ex-post, Ex-ante" + Family Office uses bridge loan to buy Retail/Office building

Ex-post

The worsening energy crisis in Europe has taken the front page of most media channels this week as the Nord Stream 2 pipeline, a 1,200 km natural gas pipeline from Russia to Germany, remains close, which is driving the Euro to a 20-year low vs. USD. The BBC reports that the annual energy bill for a typical UK household is £1,971. From 1 October, however, that’s due to rise 80% – to £3,549!!! Can you imagine paying USD4,000 a month for electricity?! The new incoming PM, Ms. Truss, will certainly be making this a top priority. We really hope for a mild winter in Europe for everyone’s interest. 

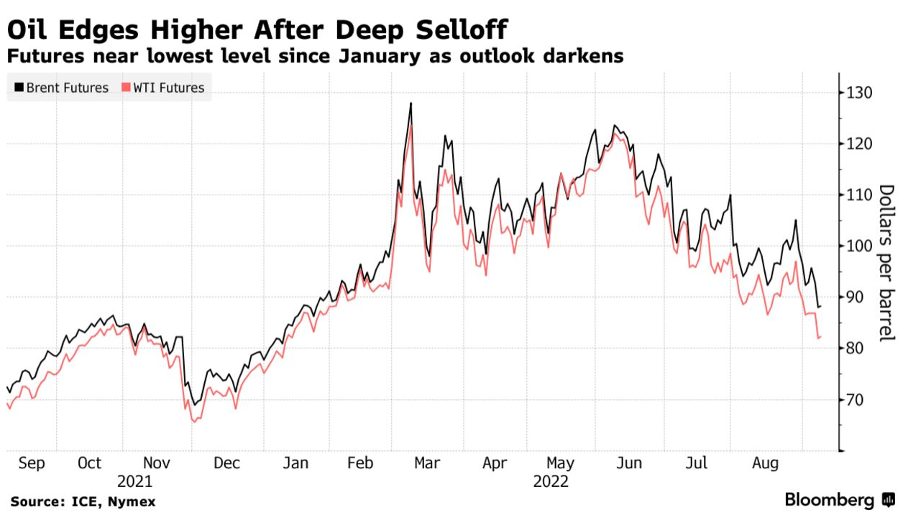
Meanwhile, the Yen is now close to a mind-boggling ¥145 vs. USD, a 24-year low! Oil at $82 is a very critical level and, technically speaking, could break lower, which could give some breathing room to the economy. Seeing Oil go from $120 a barrel in May 2022 to $85 now shows how volatile the world is and also how quickly demand can fall for the most popular commodities. 

In the US, Nonfarm payrolls were +315,000 in August (seasonally slow) vs. +526,000 in September, slightly lower than expected but a big month-on-month decline. Meanwhile, unemployment is at +3.7%, slightly higher than expected. The tight labour market while companies are announcing hiring freezes is peculiar. Could this be a recession where employment is less affected? ISM Manufacturing for August was 52.8, unchanged from July – not the decline I was hoping for to give us a little breathing room. 

US Rates30-year fixed 6.12%15-year fixed 5.32%
30-year jumbo 5.10%5/1 ARM 5.95%
* Reference only. These rates are Conforming rates, not applicable to Foreign Nationals. 

Ex-ante

I’m really keeping an eye on oil prices…I have a sinking feeling that Oil is such a consensus overweight for most hedge funds (and institutions) that technical breakthrough support (say $80) will see a further decline in oil prices which is good news for everyone! European energy prices are now generally 15-20% of GDP, and someone has to pay for it – the public or private sector. If the public pays for it, it will have to run a fiscal deficit of 15-20% of GDP, so more debt on top of the already growing debt problem. The private sector gets tricky, especially for countries that have piled on loads of debt in a short period of time. One country that sticks out is Sweden, with over 150% of private debt to GDP. Nationally, Sweden’s debt service ratio is 27% (highest on record). It appears Sweden, France, and South Korea are the most interest-rate sensitive countries, relatively speaking, according to BIS data. Watch this space. The negative soundbites on the European banking sector are going to get louder and more frequent.  

Buy now! Why now? 

We are in a perverse cycle where rising rates are actually squeezing up rental yields. The marginal buyer cannot afford to own given rate rises, and the Millennials also cannot afford and must rent – AND, to add to that, there is a 3.8M housing shortage according to the Fed. If you read last week’s “Ex-post, Ex-ante,” places like New York are seeing double-digit percentage increases in rents, BUT 39% of residents are looking to move given the high cost of living. It won’t be long where we are in a world where rates are 7-8%, BUT rental yields could be 15-20% (some parts of Texas can net you low teens yield already).

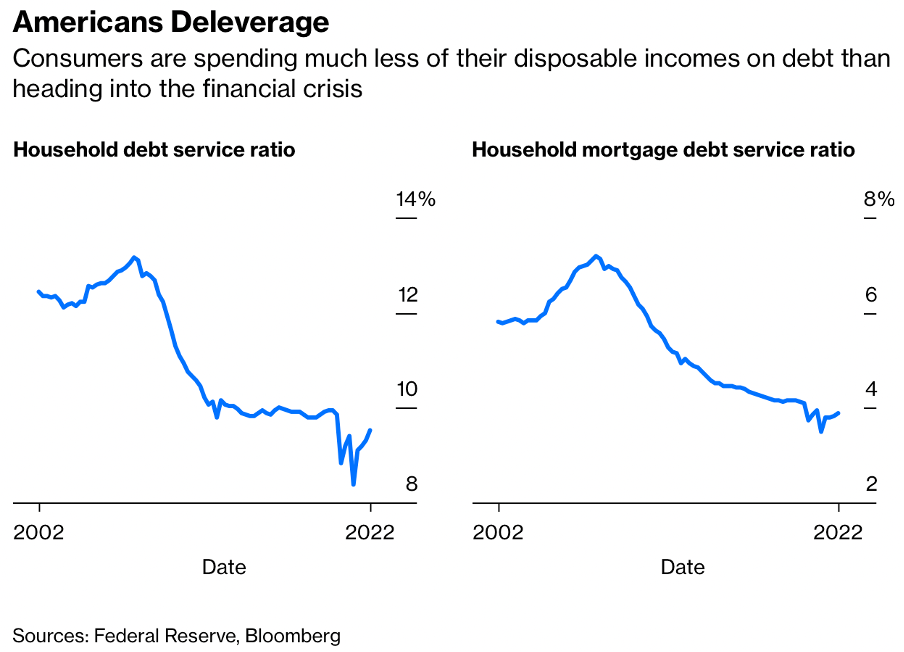
Look at this chart below from a Bloomberg article (7 September) US household debt service ratio has fallen from around 13% at the time of the last housing crisis to 10% now, according to the Fed. The amount households are spending to service their mortgage debt has been cut almost in half, from 7.18% in 2007 to a recent 3.89%! 

LOANS OF THE WEEK!

1. Indonesia family uses bridge loan to purchase $5.4M Retail/Office to maximize cash flow

Location: San DiegoPrice: $5,400,000
Property: Storefront Retail + OfficeLoan Amount: $3,500,000
Cap rate: 4.05% / 100% leasedLoan to value: 65%
Use: InvestmentRate: 8.5%
Loan: AM USA Bridge+Term: 3-year interest only

– Client was offered a bank loan at 5.75% but given that it is cash-flow based he would not be able to cover the 1.25x cash flow coverage typically required and would be able to get around 40% LTV. Our knowledge was valuable. We knew that California is a tough market as it is with very low CAP rates but the added increase in interest rates is making it even harder to achieve higher loan amounts.

– Our solution: Use a bridge loan with higher leverage, interest-only payment to get into the property. Then position the tenants for renewal of their lease agreements and refinance when rates come back, allowing for more leverage to be supported by the cash flow. Good news is the client is using this strategy to purchase more yielding assets in the US. Loan managed by our Head of Sales, [email protected]

2. Canada tech entrepreneur buys $1.25M condo in Miami

Location: MiamiPrice: $1,250,000
Property: CondoLoan Amount: $875,000
Use: InvestmentLoan to value: 70%
Loan: AM Foreign National+Rate: 6.875%
Term: 30-year fixed

– Client wanted to start building rental portfolio in the US to earn income and to begin developing a credit footprint for future family and business opportunities. Given the nature of his business, he was not able to find bank financing in Canada and we were able to find a mortgage which used his Canada credit and income to qualify.  Funded in 43 days with the help of our Canada-based loan officer, [email protected]

3. UK family buys $850K Boston condo in son’s name to develop credit

Location: BostonPrice: $850,000
Property: CondoLoan Amount: $595,000
Use: InvestmentLoan to value: 70%
Loan: AM Foreign National+Rate: 6.875%
Term: 30-year fixed

– Client bought condo in son’s name to rent out while his son attends boarding school on the East Coast.  The intention is for him to stay in the condo upon graduation from university in 4-5 years or continue to rent out to bolster his income while starting out on his career, meanwhile developing US credit for himself.  Our UK-based loan officer provided a hassle-free experience throughout their mortgage journey, [email protected]

Schedule a call with us at [email protected] to find out more! 

www.americamortgages.com

“Ex-post, Ex-ante” + When rates will fall

Welcome to our newly revamped weekly product, where we do a quick summary of salient news over the past week and what to expect the following week and beyond. It took a while to think of a catchy name for our weekly and we hope you like it. We also plan to include our house view of the major macro events and, of course, how it all relates to the global real estate markets, in particular the US.

Contents:

  • Ex-post; Ex-ante
  • Will rates decline? Yes, starting in March!
  • Why US home prices will not collapse
  • Buyer’s Guide to California
  • Loans of the week! 

Ex-post

Last week saw major headlines with UK printing a 10% inflation number and Europe continuing to see hefty price increases in energy costs, with Germany at €700 ($696) a megawatt-hour, up from under €50 in January. 

In the US, mortgage applications dipped slightly for the week ending August 12, 2022, down 2.3% week on week. Things are generally slower in all areas of the economy in August, and this is no different. 

30-year fixed rate 5.45% mortgages are down 50 bps from June 2020 highs of 5.98%

* This reference rate is for conforming Fannie Mae loans, not applicable for overseas borrowers.

Ex-ante

This week, all eyes will be on Jackson Hole, where Fed chair Jerome Powell will speak on the economic outlook at 10 am Washington time. We cannot see Powell becoming incrementally dovish at this stage, while there could be an outside chance of being less hawkish. As a firm, our house view is that given the fact that the “reputation and credibility as an institution” is under pressure, the Fed will risk over-tightening in this economic cycle – right or wrong. To us, tightening into a recession is extremely heavy-handed, but Powell certainly does not want to be remembered as Arthur Burns 2.0. 

The Trillion-dollar question is IF rates will be cut, and if so, how much?

If you look at the Eurodollar implied futures curve, you will see that the market is expecting rates to peak in March 2023 at 3.93% and then start to decline to 3.51% by December 2023, and drop to 3.03% a year later. That is to say; the market is expecting 90 bps of decline in Fed Funds by December 2024! The charts also imply that rates are expected to stay under 3% thereafter.  

3-month Eurodollar Futures Yield Curve

Credits: Barchart.com, GMG Macro Research

ISM Manufacturing Index – US 30-Year Mortgage, YoY%, 18-Month Lead Inverse”

One area of potential concern is US industrial production, which is at risk of significant contraction (below 50 on ISM Manufacturing Index is a contraction). If so, this could trigger deeper recession concerns. The next the Institute of Supply Management (ISM) report will be out September 1st. 

If you look at this chart, it appears that the ISM Manufacturing Index (black line) lags the inverse of the US average 30-year mortgage rates (red line) by about 18 months. If the US manufacturing economy pans out in this manner, the Fed may be forced to make deeper cuts and we could see a bigger decline in rates than the market is pricing in, giving another opportunity for US home buyers who are waiting for lower rates! 

Credits: TradingView, GMG Macro Research

Home Prices

There is no impending collapse. We see strength in housing prices.

As we read in the media that home prices are softening, housing starts declining, home prices are falling, and it paints a doom and gloom picture, but we cannot see a collapse in housing prices and a repeat of 2008.  

Did you know that 40% of all homes in the US are held free and clear without a mortgage?

The average outstanding mortgage is 33% of home values. There is simply too much equity in the market for a collapse. Since 2008 underwriting standards have been significantly more stringent with more regulatory oversight. More importantly, most of the outstanding mortgages were printed when rates were below 4%!

Sure, in some cities, there will be softening as residents gentrify out to lower cost of living areas. It’s no surprise that San Francisco, Los Angeles, and New York City are at the tops of those cities where there are significant outflows of residents.  

According to a Redfin article on July 18, 2022, here are the:

Top outflow cities in 2Q2022:

San Francisco48,718Top destination: Sacramento
Los Angeles  40,632Top destination: San Diego
New York City 48,731 Top destination: Philadelphia

Top inflow cities in 2Q2022:

Miami12,614Top origin city: New York City
Tampa7,939Top origin city: Orlando
Phoenix11,464Top origin city: Los Angeles

Buyer’s Guide to California

Over the past 2 weeks, we have published a Deep Dive into what drives overseas buyers to California. In Part 1 – Education. We look at the top 50 public and private high schools in the state, average SAT/ACT scores, Median Income and Average Home prices and conclude the cities with the top schools tend to have the strongest property price appreciation and rental reversions.

In last week’s Part 2 – Demographics. We look at the Asian population in each of these schools and conclude the schools with the highest Asian population is another driver of home prices where the top schools are located.

This week, in Part 3 – Taxes and Benefits. We will conclude the report with a tax guide for overseas investors, how rental income is taxed and various deductions that are allowed.  

Finally, to wrap-up our Buyer’s Guide to California, we will be hosting a webinar with Susan Kim, our Private Client US Concierge Partner and top real estate experts in San Francisco, Palo Alto, Los Angeles, and Orange County to give you an on-the-ground discussion on the respective cities, where the value is now and in the future. Stay tuned!

Loans of the week!

1. Switzerland Family Office purchases luxury condo in New York

Client wanted options outside of their private bank which did not require pledging assets.

Type: Luxury Condo

Price: $20M

Loan Amount: $11M (55% LTV)

Use: Second home

Loan type: America Mortgage HNW+

Qualification: Using borrower’s liquid investment portfolio as a reference without encumbrances. (Example Fidelity account)

Term: 5-year fixed / 30-year amortized

Interest-only: Fixed for 5 years

Rate: 7.875%

2. UK technology entrepreneur purchases home in Atherton (near Palo Alto)

UK-national client attended Stanford and plans to move their children there in 3 years to attend high school. His goal was to rent out the home to tech executives or AirBNB in the interim.

Type: Single-family home

Price: $10.9M

Loan Amount: $6M (55% LTV)

Use: Investment

Loan type: America Mortgage HNW+

Qualification: Using borrower’s liquid investment portfolio as a reference without encumbrances. (Example Fidelity account)

Term: 5-year fixed / 30-year amortized

Interest-only: Fixed for 5 years

Rate: 7.25%

3. Singaporean family purchases home in San Antonio for rental income

Father attended the University of Texas and, after reading our Deep Dive report, decided to own a home where he could take advantage of the strong USD and rental income currently in San Antonio and potentially will move there for retirement.

Type: Single-family home

Price: $350,000

Loan Amount: $245,000 (70% LTV)

Use: Investment

Loan type: America Mortgage Foreign National+

Qualification: Based on overseas income and credit

Term: 30-year fixed

Rate: 6.875%

Thank you and feel free to contact us if you have any questions.

www.americamortgages.com

Buyers Guide to California Pt 2 – Demographics

Buyers Guide to California Pt 2 - Demographics Matter

CALIFORNIA

Californication, Red Hot Chili Peppers

In last week’s “Buyer’s Guide to California Pt 1 – Education Matters,,” we discussed why Education is an important driver of where overseas borrowers choose to invest in real estate. 

In that report, we looked at the top 50 Public, and Private high schools, average ACT/SAT scores, Median Household Income, Average Home Prices, and Rental Yield.

We argued that when looking at where to make your US property investment, the quality of education in the nearby city/area is a factor in the decision since there is always a notion of “can I live there one day” and “maybe my children can go to school there”. Popular cities in the US will undoubtedly have good schools in the city or in the vicinity. 

“Popularity as a living destination” in turn drives demand, home value appreciation, and strong growth in rental income.

This week we focus on Demographics.

An under-appreciated factor in determining where to own is what city has the most culturally similar population. It’s much easier when you have neighbors that speak your language and share similar cultures and values. 

We will answer these questions (and much more)!

  • Which high schools in California has the highest Asian population?
  • Which cities have the most Korean-born residents?
  • Which cities have the highest total Asian population and the respective top schools?
  • Does the highest Asian population determine how home prices will behave?
  • Which California cities have the highest: Hong Kong, China, Taiwan, India, South Korea, and Philippines-BORN residents?

Demographics matter!

In this study, we solely focus on the Asian population in schools. Asians have been the biggest group of immigrants over the last 60++ years, spurred mainly by the Immigration Act of 1965 but also the Taiwan Relations Act of 1979, the Luce-Celler Act of 1946 as well other obvious political issues of the time.

In addition to the above reasons, many immigrants just wanted a better life for their families, they studied hard, and slowly communities grew around the top education destinations.

Here is the Asian population (>40%) for the top 50 Public and Private Schools in California.

You can also see that these cities have the highest Home Price to Median Income ratios, highlighting the center of attraction for Asians moving to the US.

Note a common rule for affordability is for a home price to be UNDER 3x your income!

Public High Schools

Private High Schools

Takeaway – You can see cities where the top schools are located have very high Home Price to Income Ratios which highlights the property value growth driven by families moving to these cities, in particular Asians.

The next study is very interesting!

Our team looks at which California cities have the highest overseas-born residents, specifically from:  China, Hong Kong, Taiwan, South Korea, Philippines, Vietnam, and India.

You guessed it, many are in the cities where the top schools are

We only used cities with over 20,000 population.

*Refer to full chart below

Here is same chart in Alphabetical Order

Illustrating popular cities ranked by multiple demographics

As you may observe in this report, the cities with the highest Asian immigrant population tend to be where the most demand is, especially when compared to household income, and it’s no surprise it’s also where the top high schools are.

That is to say, the schools and cities mentioned in last week’s report on Education being the main driver of price appreciation and rents are very similar to the cities mentioned in this report.

While this study is not meant to be a rigorous analysis by any means, it is close to my heart since I moved from Singapore to San Francisco when I was 16. My parents had the same thought process…strong Hong Kong population and good schools. I ended up finishing high school in San Francisco and attended UCLA.

Stay tuned for the final part of our Buyer’s Guide to California, where we take a quick look at the general carrying costs for a rental property, including taxes, deductions and other administrative costs. 

Finally, we will be hosting a webinar with our California Partner for a real “on-the-ground” discussion along with a panel of real estate experts for the Bay Area, Palo Alto, Los Angeles, and Orange County. We are still finalising the exact details, but this will be in September. 

Have a good weekend!  If you want a copy of the spreadsheet with the data from our research, please contact us. We are happy to share our findings.

www.americamortgages.com

Buyers Guide to California – Education drives prices and rents

CALIFORNIA

“California, Here we come” Phantom Planet

(click for an awesome Indie rock song from 2002)

We are super excited to kick off our “Buyer’s Guide to U.S. Real Estate” series, where we go in-depth into the main U.S. states for property investment purchases, starting with California!

We also have a surprise guest at the end of the month (see bottom of article)!

What’s not to love about the Bohemian vibes of San Francisco, the technology center-of-the-universe in Palo Alto, wineries in Napa, food in Yountville, golf in Steinbeck country, the quaint and exclusive Montecito, and year around perfect weather in San Diego.  

And finally, Los Angeles – Beverly Hills, Hollywood, Venice Beach, Santa Monica, Bel Air, Pasadena, Orange County – it’s almost endless. 

It’s no surprise that California is a favourite investment destination for our clients, both Overseas Expats and Foreign Nationals, primarily from: the U.K., Canada, Australia, Mexico, China, Hong Kong, Singapore, Philippines, Indonesia, Australia, France, UAE, Germany to name a few.

Want Home Value Appreciation and Rental Income Growth?

Education is key!

Job market growth is certainly a key driver for price appreciation and is normally driven by the new business formation in the area, but popularity as a living destination is driven by things like safety, cost of living, ease of transportation and quality of education, especially for families with young children.   

“Popularity as a living destination” in turn drives demand, home value appreciation, and strong growth in rental income. 

Why is Education important?

In this week’s report, we will take a deep dive into Education – an important (if not the most important) factor for overseas property investors in determining where your next home purchase will be in the U.S.

With Foreign National buyers, in particular, the objective of owning real estate to earn income almost always comes down to “could I live there one day”?   

In Asia, where owning property is ingrained in their culture, it’s common to purchase an investment property “in anticipation” of sending their child to college. They could even live there during or after they graduate, and the price appreciation could even pay for college if they sell the property. Or, if the child decides to get a job in the U.S., they can stay in the apartment as a post-graduation gift to build up their credit or even rent it out to earn income. 

Which are the top high schools in California?

We look at the top 50 high schools in California, both public and private, ranked by average SAT and ACT scores. As you can see, the SAT scores will range from 1300-1500. To get into a top 25 U.S. university, the SAT scores should be at least 1400 as a reference, so these schools are all great.

Why high schools?

Many new immigrants or returning expats will choose to live in areas where there are good schools and a higher population of similar background families (the latter we will investigate next week). High schools are a very important decision since it will determine their experience during these formative years between 14-18 years old but also potential college choices. 

“Popularity as a living destination” drives demand, home value appreciation, and strong growth in rental income. 

Schools with the highest SAT/ACT scores

– Public: Lynbrook High School, San Jose

– Avg SAT 1450 / ACT 33

– Private: The Nueva School in Hillsborough & Basis Independent in San Jose

– Avg SAT 1510 / ACT 34 for both

Household Income, Home Prices, and Rental Yield

We also look at the Median Household Income, Average Home Prices, and Rental yield in each city. When moving to a new city, aside from the quality of education, most will look at how expensive it will be to live there, own a home, and potential rental income potential. 

It’s probably no surprise cities like Palo Alto, San Diego, San Jose, Los Angeles, and others will have higher home prices, but we also look at a rough gauge of affordability which is a “Home Price to Income Ratio,” which tends to be where most immigrant buyers choose as their base.

Cities with the highest Median Income

– $250,000+ per annum income

– Cities: Piedmont, Hillsborough, Los Altos

– Neighbouring schools: Piedmont High School, Los Altos High

Cities with the highest Home Prices

– $2,000,000+ home price

– Cities: Piedmont, Palo Alto, Hillsborough, Ross, Atherton, Los Alto, Saratoga, San Marino

– Neighbouring schools: Piedmont High School, Los Altos High, Palo Alto High, Henry Gunn, Aragon High, Nueva School, Crystal Springs Uplands, The Branson School, Menlo High, Pinewood School, San Marino High

Highest Rental Yield

>5% gross yield: Riverside
>4% gross yield: Lo Jolla, San Diego, San Jose, Fresno, Irvine, San Clarita

– Neighbouring schools: Riverside STEM Academy, Canyon Crest Academy, Torrey Pines High, Westview High, Del Norte High, The Bishops School, La Jolla Country Day School, Francis Parker School, The Harder School, Basis Independent, Bellamine College Prep, Notre Dame High, University High Fresno, University High Irvine, Woodbridge High, Arnold Beckham High, TVT Community Day School, Academy of the Canyons

America Mortgage Concierge Program

We launched this free service last month to connect potential home buyers with our approved panel of realtors in each major U.S. city, which only focuses on overseas buyers. If you would like to learn more, please contact [email protected].

Our surprise guests!

At the end of August, we will be hosting a webinar with our California partner, who will present a “Guide to California Real Estate” along with a panel of the top realtors in Los Angeles, Orange County, and Bay Area to give you a real “on the ground”feel for all the points we discussed above and more.   

Stay tuned…this is going to be amazing! 

Sources: Niche, City-Data, US News, OECD data, US Census Bureau and respective school websites

Making a case for U.S. Residential Property Investment: “Let’s Look Under the Hood”

Making a case for U.S. Residential Property Investment

“Let’s Look Under the Hood”

In the previous 2 weeks, we have discussed U.S. real estate investment’s relative affordability and income potential.

In this week’s Deep Dive, we will look at what the Key Drivers of Property Prices are and make an argument on which U.S. cities represent the best projects for future price appreciation.

The utility of owning a home is greater than any other possession – a roof over your head, it provides a sense of security for present and future generations, the sense of incredible accomplishment that “I have MADE IT in life,” and the list goes on.

However, as an investment, we need to think about its ability to produce income (dividends/rental income, etc.) and future price appreciation.

We start this discussion by digging into what factors drove property prices in the past, what ‘new’ factors exist today, and (drumroll….) we will try to take a stab at where they will be in the future.

We will also introduce a new proprietary index: AM Job Prospect Index

First, what drives property values up?

This is a vast topic that can get very granular – see below for a snapshot of a 2019 article written by the New York Fed about Forecasting Home Prices.

But we will try to keep it simple.

Liquidity is plain and simple. The world has seen an unprecedented fiscal stimulus and monetary easing over the past 20 years.

A commonly accepted money base is M2 (Money in circulation, checking deposits, and savings deposits less than $100K).

Let’s look at M2 money supply over the past 10 years. You can see the amount the U.S. has grown its money base dwarfs any other country, and in fact, it is 4x the growth rate of the U.K. In absolute terms, the current M2 supply in the U.S. is almost twice that in Japan.

Now that we have identified the global macro drivers, we can look into where the money is flowing into – specifically real estate and, more importantly, why.

It’s not surprising that the top 5 states in terms are GDP are:

CaliforniaTexasNew YorkFloridaIllinois

This is consistent with our most popular destinations for real estate investments (see below).

Within this context, we take another cut at the data and look at which cities in those states represent the highest contributors to the overall national economy:

Here are the cities with over 2% contribution to U.S. GDP:

New York City (8%!)MiamiFort LauderdaleFort WorthDallasHouston
SeattleChicagoLos AngelesSan FranciscoAtlanta

Now we look at cities with the highest GDP growth rates (over 1% y-o-y growth 2018-2019):

SeattleLos AngelesSan FranciscoSan Jose
AustinSan AntonioPortland

You can see that these cities naturally are attractive given the size of the economy; hence the probability of finding meaningful employment is higher. Now, the list likely looks much different 2020-2021, which I’m guessing will magnify the growth potential in the Texas cities even more!

Next, we will look at why these cities.

We have identified 3 main factors that raise the demand for properties in an area – 1) Economic prospects, 2) Gentrification 3) The China Effect

1) Economic prospects

AM Job Prospect Index

Our multifactor algorithm includes factors like the number of big companies moving to these cities, market capitalization of the new companies, new headquarter size, etc.

Using our “AM Job Prospect Index, in general, job prospects of U.S. cities appear to be better than other global cities. The average job prospect index for the U.S. is 70, but only 30 for other cities (the higher, the better). In the U.S., cities with the best job prospects are Austin, Dallas, Miami, Los Angeles. Austin, TX specifically, has the highest value as numerous big companies are setting up headquarters there– Tesla, Google, Amazon, SpaceX are just a few. Tesla’s new manufacturing plant in Austin alone will hire more than 10,000 through 2022. We can expect plenty of people to move to these cities, meaning increased demand and elevated home prices in these areas.

2) Gentrification

Gentrification is the process of changing the character of a neighbourhood through the influx of more affluent residents and businesses. When wealthier residents move into a neighbourhood, they often renovate homes, making them more aesthetically appealing and equipped with better facilities, which increases the value of the property. The addition of new and more “hip” businesses in the city also aids in job creation and can attract more people, increasing the demand and prices of homes.

According to the NCRC Research report, taking into account the number of neighborhoods gentrified and the intensity of gentrification, New York, Los Angeles, San Francisco, Houston, Austin, Miami are the most gentrified cities in the U.S. (arranged in order). Therefore, we can expect home prices to appreciate in these cities.

3) The China Effect

Instead of the usual demographic factors like immigration, we’ll look at the percentage of the population who are Chinese. Why do we do so? China has experienced rapid growth in recent years, and its people have gained a significant amount of wealth. It’s no surprise that according to the National Association of Realtors annual report of International Buyers of U.S. residential real estate, China was ranked #1 for the past 5 years.

Excluding predominantly Chinese cities, we see that the average percentage of Chinese the U.S. cities (9.85%) is higher than those in other major cities (8.25%). Thus, we can expect Chinese investors to be more inclined towards U.S. cities, demanding more houses and driving up prices in U.S. cities more than other cities. They will typically choose areas with a significant Chinese population as it offers a sense of familiarity. U.S. cities with the highest percentage of Chinese population are Los Angeles, San Francisco, New York, Seattle.

Based on the abovementioned factors and looking at the “top performers” in each category, prices will likely appreciate the most in Texas, Los Angeles, Miami. This is also in line with the price appreciation data provided by Case-Shiller Home Price Index and Zillow. Prices appreciated by 35.07% in Austin last year!

In summary, the conclusions in this report are consistent with our previous 2 reports. There is a tremendous amount of value in the Texas cities, with its abundant jobs, high wage growth, low taxes, easy of travel, strong ethnic mix, and the list goes on.

New York will always have a premium, and Los Angeles and San Francisco will always have specific attributes which make them unique.

HOWEVER, the high cost of living, home prices, and state taxes are quickly driving residents to other states. Almost every metric we see supports this argument. Gentrification in the U.S. is real and is happening much faster than we can imagine. Just look at new home sales from the largest home building company Lennar. They cannot sell enough homes, and it’s the Gentrification Effect we discuss above.

One area that the U.S. has lagged behind its low-cost international peers over the past 10 years is the vocational workforce – smartphone manufacturing, assembly, etc. This was a growth engine in the 80s before the Japanese began their auto manufacturing dominance. But slowly, the U.S. economy retooled and prospered again. Then in the early 2000s, the steel industry lost millions of jobs to low-cost manufacturers overseas, and those jobs have not returned.

The current trend of technology companies moving major offices inwards (See Texas) not only helps the local economies but it reflects a bigger theme – vocational employment. It may not be assembling smartphones, but it will be something else – smart cars, smart cities, smart grids, distribution centers, cloud kitchens, drone deliveries, and so on. Technology is clearly the growth driver going forward, and if you are thinking of real estate as an investment, you should look at states that offer this type of value. Right now, it is clearly Texas, and I suspect there is still more room to go here.

In next week’s Deep Dive, we will be bringing in a U.S. Tax Accountant who focuses specifically on U.S. Expats to explain how the tax regime on owning U.S. property is not as bad as you think and, in fact, could be the easiest and most flexible in the world!

Keep your eyes peeled and subscribe to our newsletter, so you don’t miss out! www.americamortgages.com

Making a case for U.S. Residential Property Investment: “It’s not Apples to Apples”

Making a case for U.S. Residential Property Investment

“It’s not Apples to Apples”

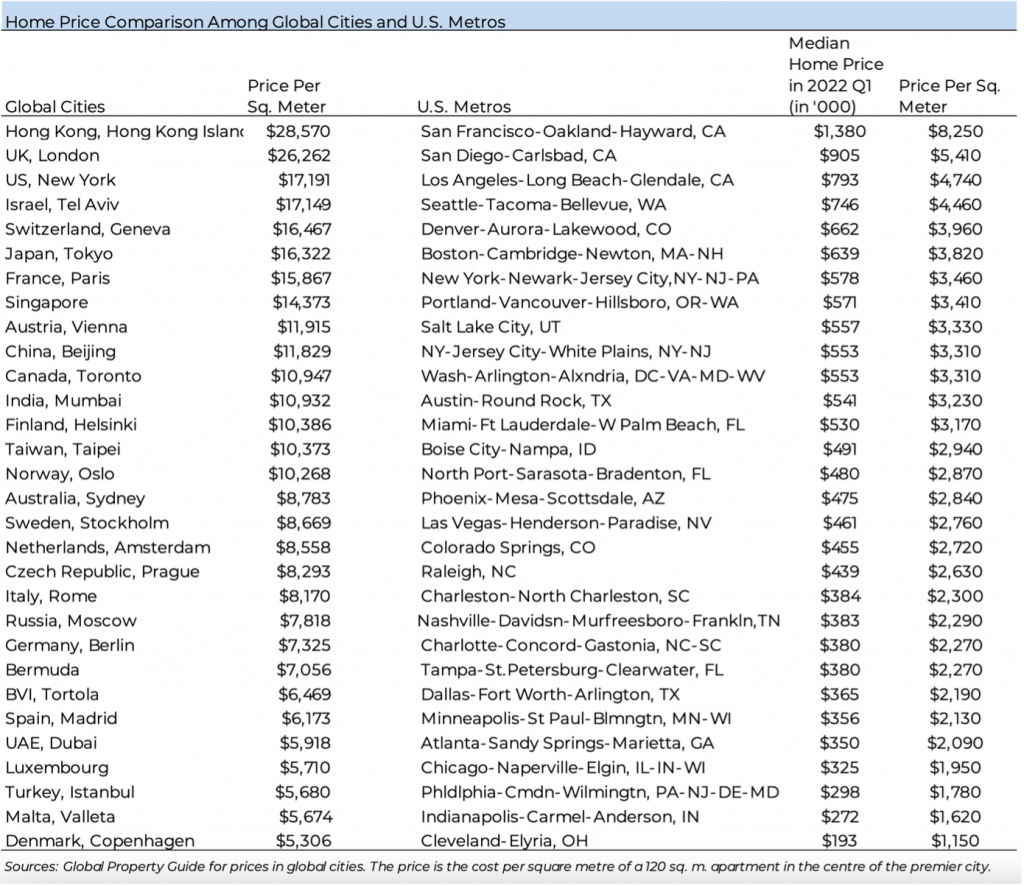
As you may recall, last week, we looked at the affordability between popular U.S. investment destinations compared to major cities in the world. We argued that the U.S. offered the best “entry price” for real estate investments on absolute terms and when adjusted for affordability.

This week in Part 2 of our Deep Dive Series, we look at the Relative Income Potential of the popular U.S. investment destinations compared to major cities in the world.

Investing in residential properties or buying-to-let is a form of a business, and as a business owner, making a profit is of priority. A common metric that we use to measure the profitability of a real estate investment is rental yield. Net rental yield measures the profit you generate each year from your investment as a percentage of its value.

Same as what we did last week, we shall compare data sets from 2 sample groups:

1. Major global cities:

TorontoVancouverLondonSydneyMelbourne
ShanghaiBeijingHong KongSingapore

2. Top U.S. residential real estate investment destinations:

New York, NYMiami, FLOrlando, FLFt Lauderdale, FLFt Worth, TX
San Antonio, TXAustin, TXDallas, TXHouston, TXSeattle, WA
Chicago, ILLos Angeles, CASan Fran, CASan Jose, CAAtlanta, GA
Portland, ORLas Vegas, NV

On average, the net rental yield of popular U.S. real estate investment destinations is 3.49%, much higher than that of other global cities – 1.39%. This means that on average, for a property that costs USD 500 000, you can earn approximately USD 17,450 if this property is in the U.S. and only USD 6,950 if this property is in other global cities. This is after accounting for property taxes. We see that investing in the U.S. can earn you 2.5 times the income you will earn in other cities!

In the following chart, you will see the disparity in the profit flow more clearly.

Now, if we look at the net rental yield that takes into account both local property and rental income tax as part of the costs, we can see that the results are similar. U.S. destinations, on average, have a much higher yield than other global cities (3.40% vs. 1.36%).

Note: Even after considering income tax, investing in the U.S. can still earn you 2.5 times the income you will earn in other cities.

Myth Buster – The common misconception that the U.S. tax regime makes investing difficult and not feasible is unfounded. Even adjusting for taxes, U.S. residential real estate is superior investment.

To further strengthen our point that the income potential of U.S. cities is much higher than other global cities, including your home cities, take a look at the table below. If you live in the cities stated in the row, you should definitely not buy-to-let in the cities highlighted in red as the income potential in those cities is worse than your home. Instead, it would be best to invest in the cities highlighted in yellow, where yield is much higher.

Net Rental Yield differences between Major Global Cities and U.S. Residential Real Estate Investment Destinations

Let someone else pay for your mortgage.

To make things better, in some U.S. cities, you can even pay off a sizeable portion of your mortgage loan with your post-tax rental income. Using the AM debt coverage ratio, we see that in cities such as Orlando and Fort Worth, without considering other maintenance costs of your home, your annual post-tax rental income can cover all of your annual mortgage payment (with some to spare). This is rare in other global cities. In Hong Kong, annual post-tax rental income can only cover 17% of the yearly mortgage payment.

The following diagram shows the debt coverage ratio comparison (the higher, the better).

Solely based on net rental yield, you should always consider Orlando, Fort Worth, San Antonio, and almost never San Francisco. It is interesting to see some overlap with last week’s affordability rankings, where Fort Worth and San Antonio were at the top and San Francisco at the bottom.

Just like affordability, rental yield is also just another aspect of property investment. It is important to consider other factors too – growth potential of the city, capital gains, future price appreciations – which we will discuss in our next report.

To summarize, we see that U.S. real estate properties are outperforming other major global cities in terms of affordability and income potential.

Next week, we will get an even bigger picture by understanding the factors that drive property value growth and why these factors will affect U.S. real estate investments more than other major global cities. You won’t want to miss out!

Stay tuned for next week’s continuation of our Deep Dive series. Email Us