The “Bizarro World” references Bizarro Superman, a supervillain who lives in a world where everything is opposite. Here’s a great explanation from the TV show Seinfeld.
This reminds me of the world we live in now; mortgage rates double in 10 months, and yet, rental yields continue to increase double digits, year-on-year.
I have been telling our clients over the past few months that it is a great time to be owning a home in the U.S. for investment income. Most of us have lived through a few economic cycles, and for most of my career, 30-year fixed rates were between 6-7%, which is when I got my first mortgage in 2006, similar to where rates are now.
However, back then, you owned homes almost as leveraged equity, not like what it’s meant to be, more similar to a bond.
When academics say real estate is an inflation hedge, that is a peculiar concept since we have not really seen any inflation since the 70s, so not many of us know what that means in real life.
Till now….
This world is very different. Good or Bad, the fact is that there are significantly more people who need housing, millennials are unable to afford homes, and the rising rates have squeezed out the marginal buyer, and all of the above need to live somewhere.
My colleagues hear me say this ad nauseam,
“We will be in a world where 30-year fixed-rate mortgages are 7%, but rental yields are 10-15% very soon”.
I will try to explain why in this report.
A few days ago, on October 13th, Redfin reported that the Median U.S. Asking Rent rose 9% year-over-year in September to $2,002, the slowest growth since August 2021 and the first single-digit increase in a year. Sure the article makes it sound bearish.
Wait a minute? (sound of car screeching on the pavement).
Mortgage rates have doubled since the beginning of the year, and yet rents are still rising 9% a year. (As recent as May, rents rose +18% year on year!)
While visually, it does look like rents are falling, but that was from an outlier peak of 18% in May….my personal view is anything that has growth in this world is POSITIVE!
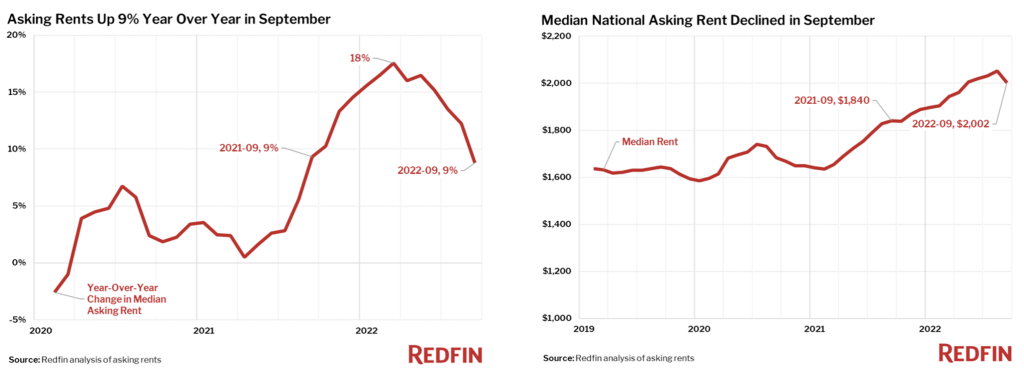
In some cities like Oklahoma City and Pittsburgh, rents rose by more than 20% year-on-year (not a typo). More below.
THE PROBLEM – HOUSING SHORTAGE
A housing shortage is not something you can really see. We hear it on the news or read it in the papers, and we think…how can that possibly be an issue.
Can’t homebuilders just build more homes?
The NABM/Wells Fargo Housing Market Index dropped three points to 46 in September, the lowest reading since May 2014!
Meanwhile, “Application to Build” declined to 1.52M units, the lowest since 2020.
Number of Building Permits (SAAR)
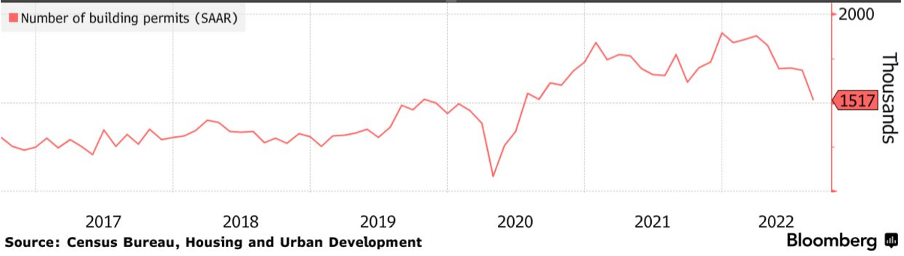
One could also conclude with higher borrowing costs, homebuilders are discouraged from starting new projects, which is not helping the undersupply situation.
Another aspect of this is the financial incentive.
Like many other issues in the U.S. economy, there has been a focus on shareholder returns, dividends, share buybacks, etc., and hence the underinvestment in housing development since the Financial Crisis in 2008.
In fact, fewer homes were built in the U.S. in the 10 years following the 2008 financial crisis than in any decade since the 1960s! Think about that for a moment!
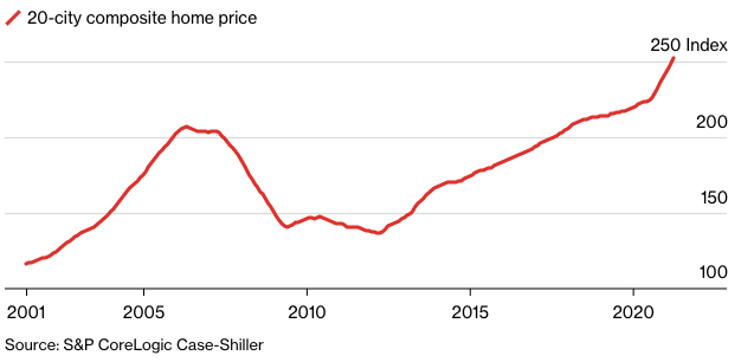
In the normal world, high mortgage rates tend to bring down values, and of course, there are some parts of the U.S. that are seeing a relatively faster decline in home prices, like San Francisco. I would argue that is city-specific, as the local economy hollows out and the homeless situation and cost of living is untenable for most.
Across the nation, there are indeed fewer sales and more price cuts on listed homes.
However, in this “Everything-is-weird” economy, the doubling in mortgage rates hasn’t caused home prices to fall as much as you would think, all things equal.
In fact, I really don’t think we are going to see any substantial collapse in home prices in the coming years because many owners bought when mortgage rates were low and can simply stay put through this phase of the economic cycle.
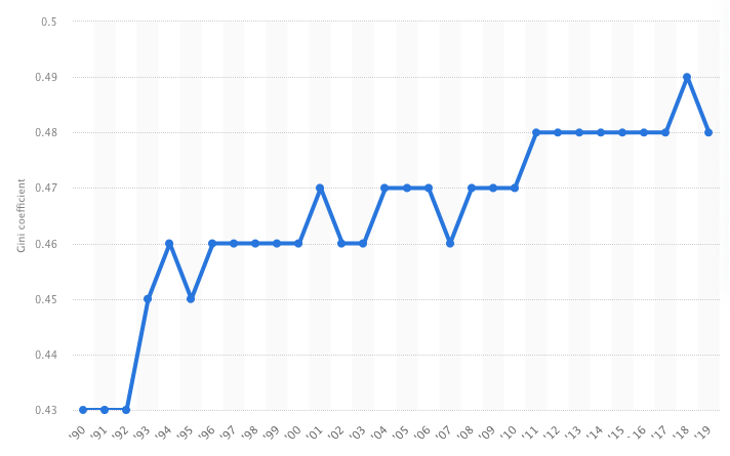
Also, there was less speculation, and investors put more equity in the properties during a time of tight supply. This will keep many families locked out of homeownership and forced to rent.
Here are some mind-blowing data points: Around half of all mortgages outstanding are under 4% fixed for 30 years, and about 40% of all homes are owned free and clear. Think about that for a moment!
Last month, Philly Fed President Patrick Harker discussed his recent research report with most major news outlets, “Unpacking Shelter Inflation”, September 2022, that the housing shortage is a key inflation driver. Read: “…housing shortage…”
In another research report by the Fed, “Volatility in Home Sales and Prices: Supply or Demand?”, Anenberg and Ringo, June 2022, write:
“We find that a 30% increase in the monthly number of homes coming onto the market would have been necessary to keep up with the pandemic-era surge in demand. Since new construction typically accounts for about 15% of supply, our estimates imply that new construction would have had to increase by roughly 300% to absorb the pandemic-era surge in demand. This is a very large, unrealistic impulse to housing supply in the short-run, suggesting that policies aimed at reducing bottlenecks to new construction would have done little to cool the housing market during Covid-19.”
Read again: “…new construction would have had to increase by roughly 300% to absorb the pandemic-era surge in demand.”
Here is yet another report, this time by Freddie Mac. “Housing Supply: A Growing Deficit”, Kater, May 2022. I give a little more weight to Freddie Mac since they are actually buying the loans. Their thesis is that:
“As of the fourth quarter of 2020, the U.S. had a housing supply deficit of 3.8 million units. These 3.8 million units are needed not only to meet the demand from the growing number of households but also to maintain a target vacancy rate of 13%. Between 2018 and 2020, the housing stock deficit increased by approximately 52%.”
Read yet again! “…U.S. housing supply deficit of 3.8 million units.”
I always take stuff like this with a grain of salt because academics look at things from a 10,000 ft altitude and through the lens of an Excel spreadsheet, but the gist is that every Think Tank in the world seems to claim there is a shortage of housing supply and since they have a few more tools (and PhDs) at their disposal for this that I do, I will take their conclusions at face value.
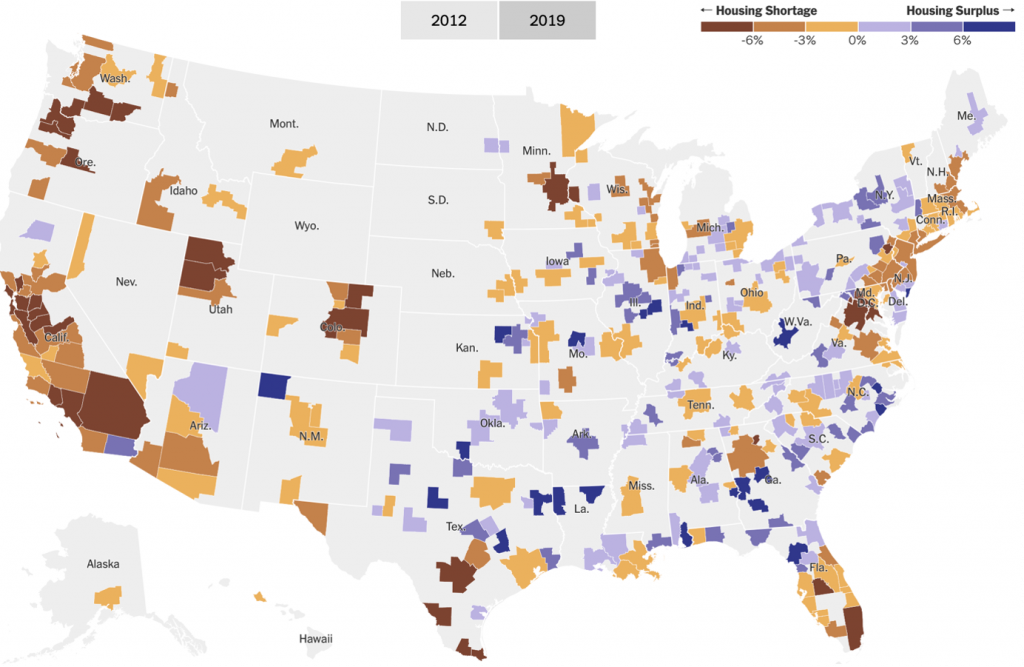
Here is a neat graphic from The New York Times, The Housing Shortage Isn’t’ Just a Coastal Thing Anymore” Badger and Washington, July 2022.
The Housing Shortage has Spread to More Parts of the Country.
Let’s look at recent city-specific rental prices:
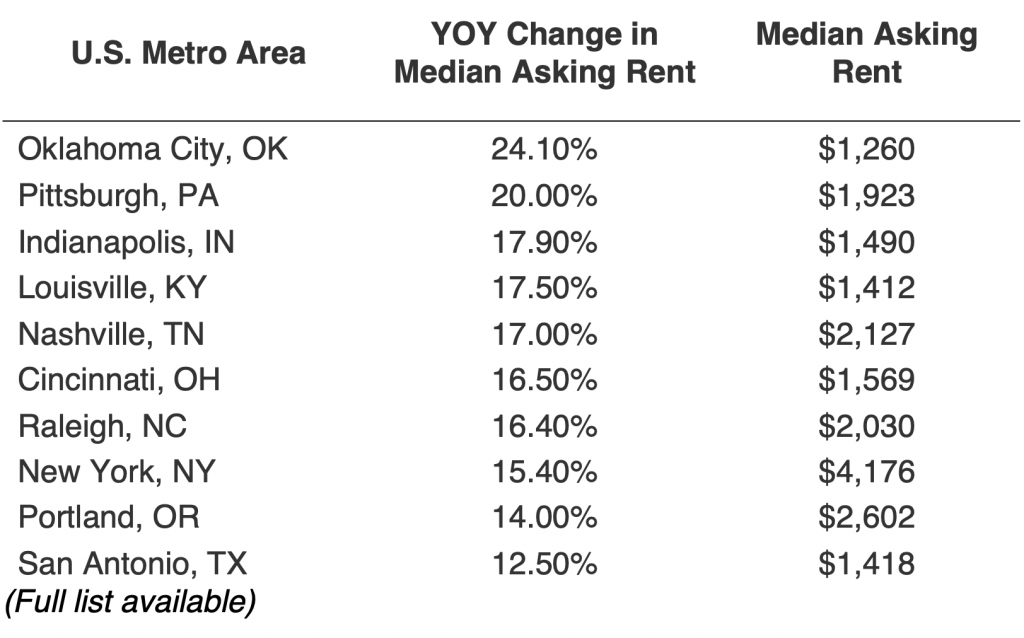
Top 10 HIGHEST Year-on-year Change in Median Asking Rent (%) *
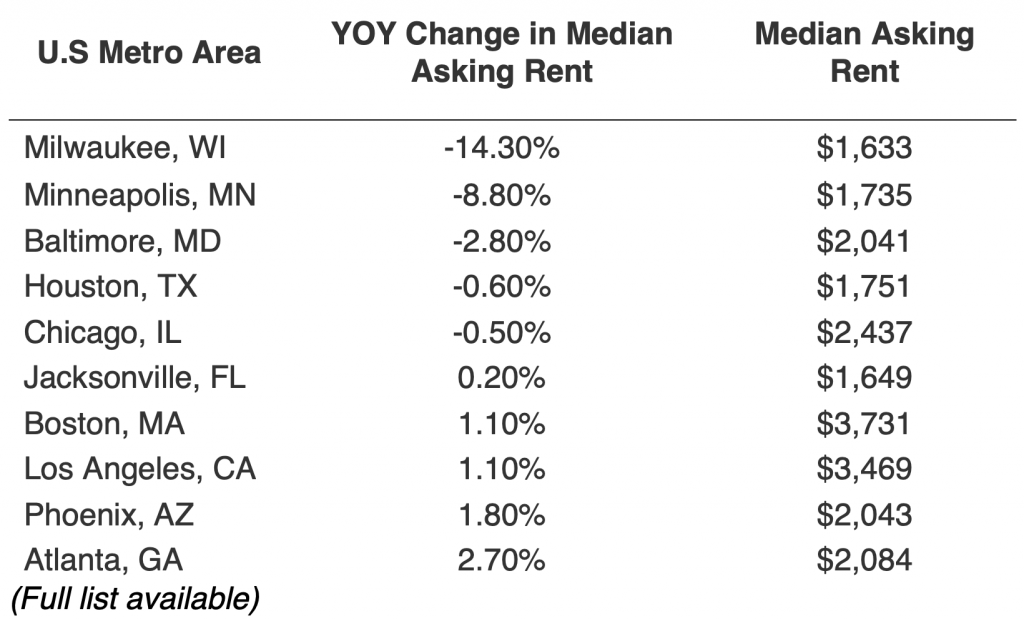
Top 10 LOWEST Year-on-year Change in Median Asking Rent (%) *
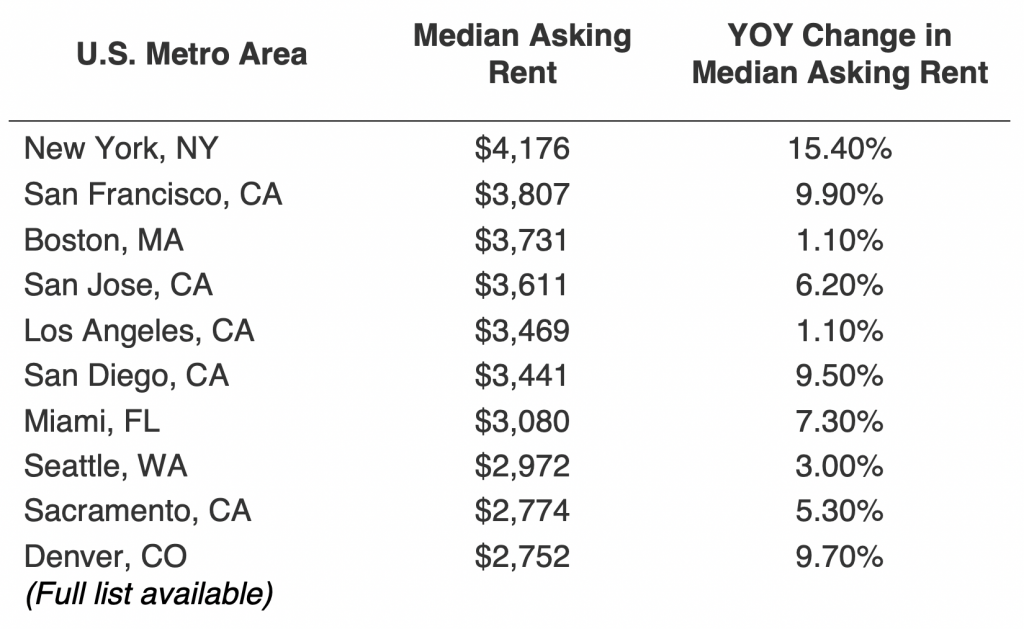
Top 10 HIGHEST Median Asking Rent *
Top 10 LOWEST Median Asking Rent *
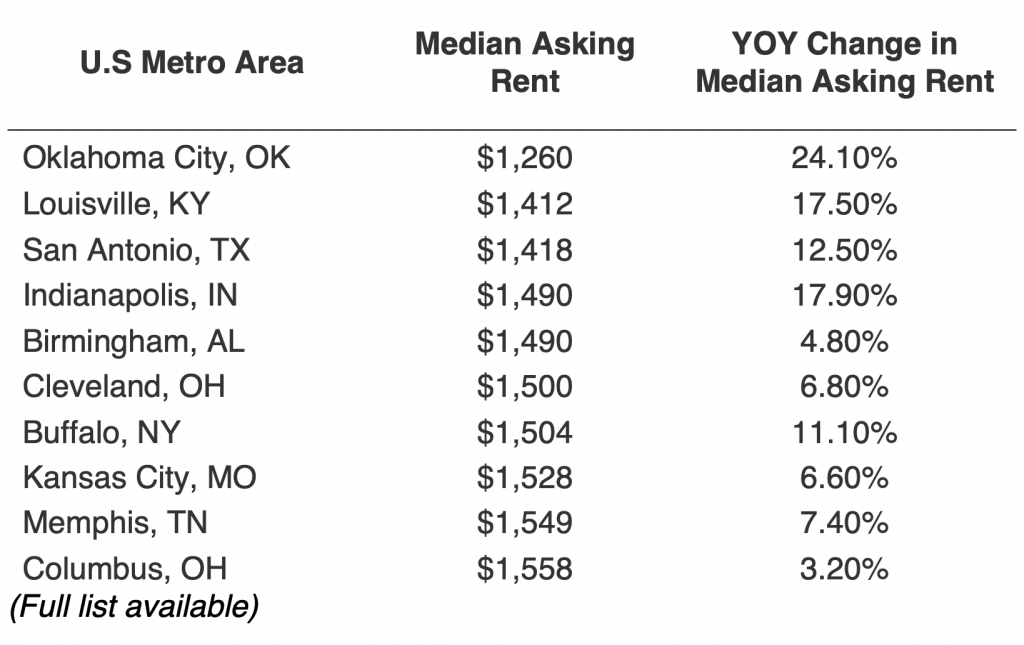
* From Redfin News: “Rental Market Tracker: Rents are Growing Half as Fast as They Were 6 Months Ago,” by Lily Katz, October 13, 2022 Methodology – Redfin analyzed rent prices from Rent.com across the 50 largest U.S. metro areas. This analysis uses data from more than 20,000 apartment buildings across the country.It is important to note that the prices in this report reflect the current costs of new leases during each time period. In other words, the amount shown as the median rent is not the median of what all renters are paying but the median cost of apartments that were available for new renters during the report month. Currently, Redfin’s data from Rent.com includes only median rent at the metro level. Future reports will compare median rent prices at a more granular geographic level.
DEMAND IS DIFFERENT NOW
Single-person households accounted for 80% of the new household units that have formed since 2020. Think your one-man Crypto trader or Tik Tok marketer. Meanwhile, the number of Gen Z adults living alone almost doubled from January 2020 to early 2022 (sounds like a lot of COVID breakups), likely using the stimulus income to get started. The point here is that the way labour formation is defined now makes this current real estate cycle and how it interacts with the overall economy very different from past cycles.
Another quirk of the world we live in is Video Conferencing. While we can imagine a world where we go back 5 days a week but in reality, my view is that how we work has changed forever and there are clear benefits for being able to Zoom. What this has done is artificially increased the living space needed (globally). That is to say, adding a corner or a room just for Zoom calls etc, driving up demand for overall living space.
SUMMARY
In summary, the makeup of the labour market, as well as the supply demand imbalances in real estate, are very supportive of higher rental prices and rental yields over the long term.
As a non-resident buyer of U.S. real estate hoping to earn income, this is the perfect storm and has only happened BECAUSE rates are rising.
We may see rates come down in the future where borrowers can easily refinance into a lower rate, but what if prices do not come down or there is a sudden price surge next year? These are all crystal ball-type guesses but what I want to leave with you in this report is that the lack of supply is a major long-term driver of higher rental yields, which is positive for any U.S. real estate investor.
U.S. real estate is considered a safe haven for many – low entry price point, no stamp duties, ease of gentrification, available tax deductions, USD income, ease of travel, quality of schooling, and the list goes on.
If you have any questions about this report or about anything U.S. real estate or mortgage related, please feel free to reach out to me directly at: +65 9773 0273 or email me at [email protected].