Buyers Guide to California – Education drives prices and rents

Education Drives Prices and Rents

CALIFORNIA

“California, Here we come” Phantom Planet

(click for an awesome Indie rock song from 2002)

We are super excited to kick off our “Buyer’s Guide to U.S. Real Estate” series, where we go in-depth into the main U.S. states for property investment purchases, starting with California!

We also have a surprise guest at the end of the month (see bottom of article)!

What’s not to love about the Bohemian vibes of San Francisco, the technology center-of-the-universe in Palo Alto, wineries in Napa, food in Yountville, golf in Steinbeck country, the quaint and exclusive Montecito, and year around perfect weather in San Diego.  

And finally, Los Angeles – Beverly Hills, Hollywood, Venice Beach, Santa Monica, Bel Air, Pasadena, Orange County – it’s almost endless. 

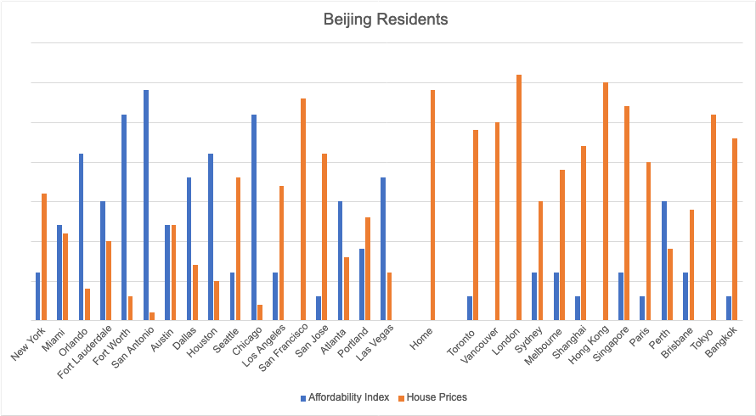
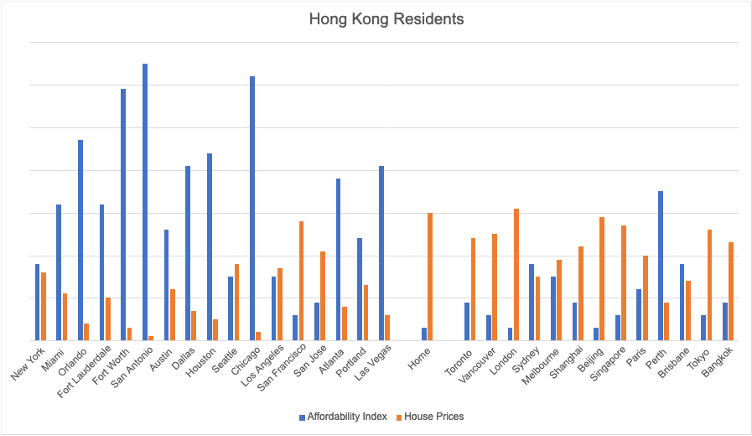
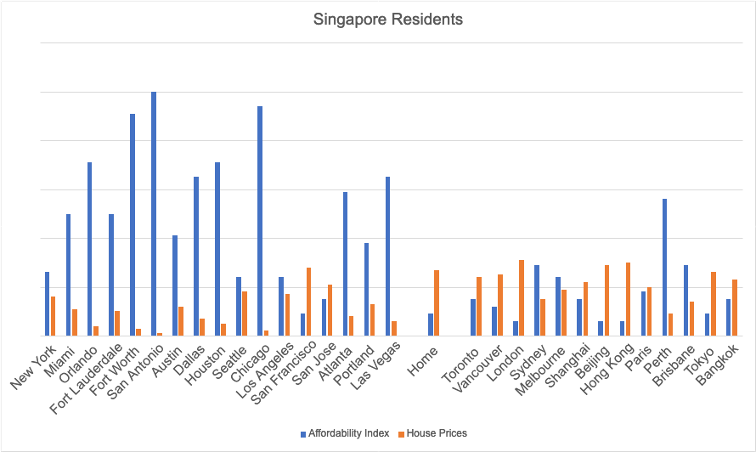
It’s no surprise that California is a favourite investment destination for our clients, both Overseas Expats and Foreign Nationals, primarily from: the U.K., Canada, Australia, Mexico, China, Hong Kong, Singapore, Philippines, Indonesia, Australia, France, UAE, Germany to name a few.

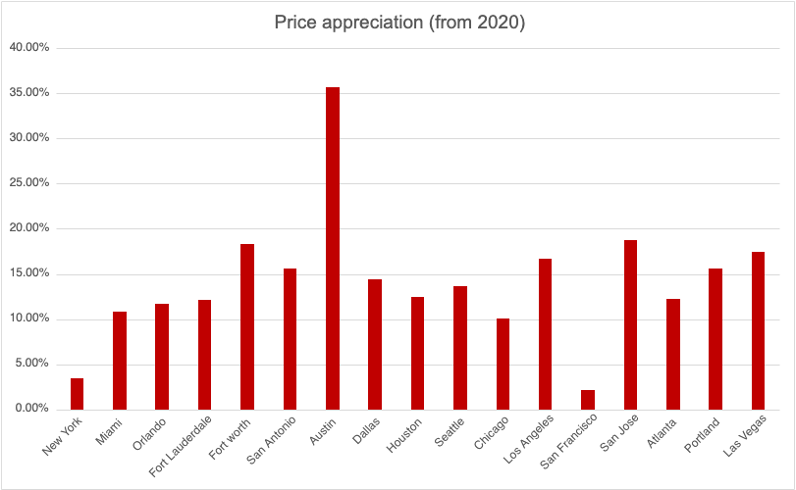
Want Home Value Appreciation and Rental Income Growth?

Education is key!

Job market growth is certainly a key driver for price appreciation and is normally driven by the new business formation in the area, but popularity as a living destination is driven by things like safety, cost of living, ease of transportation and quality of education, especially for families with young children.   

“Popularity as a living destination” in turn drives demand, home value appreciation, and strong growth in rental income. 

Why is Education important?

In this week’s report, we will take a deep dive into Education – an important (if not the most important) factor for overseas property investors in determining where your next home purchase will be in the U.S.

With Foreign National buyers, in particular, the objective of owning real estate to earn income almost always comes down to “could I live there one day”?   

In Asia, where owning property is ingrained in their culture, it’s common to purchase an investment property “in anticipation” of sending their child to college. They could even live there during or after they graduate, and the price appreciation could even pay for college if they sell the property. Or, if the child decides to get a job in the U.S., they can stay in the apartment as a post-graduation gift to build up their credit or even rent it out to earn income. 

Which are the top high schools in California?

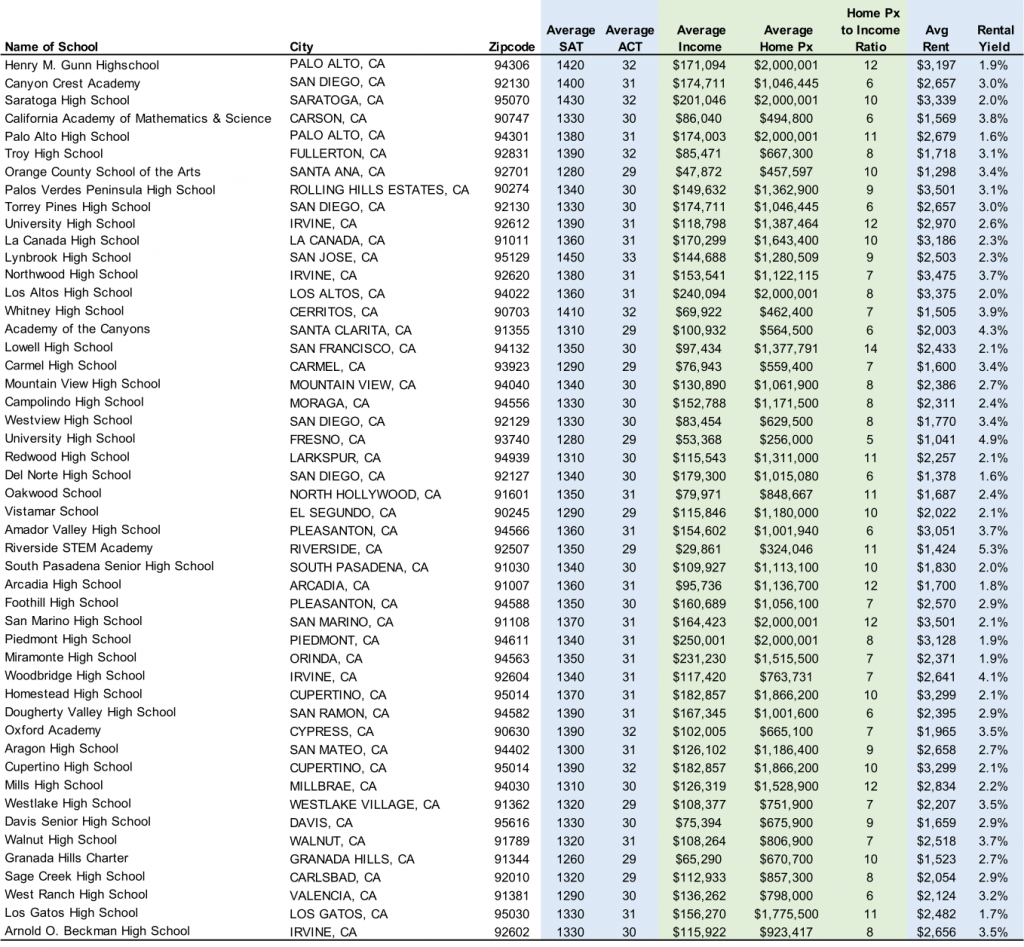
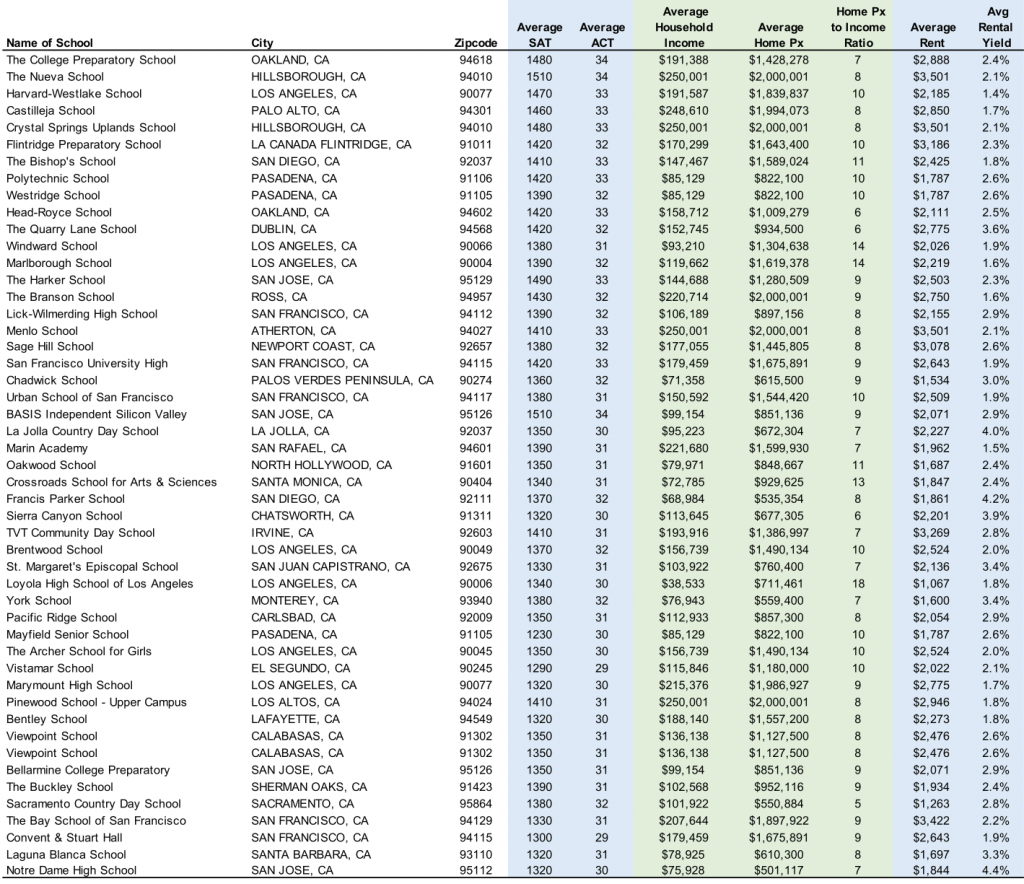
We look at the top 50 high schools in California, both public and private, ranked by average SAT and ACT scores. As you can see, the SAT scores will range from 1300-1500. To get into a top 25 U.S. university, the SAT scores should be at least 1400 as a reference, so these schools are all great.

Why high schools?

Many new immigrants or returning expats will choose to live in areas where there are good schools and a higher population of similar background families (the latter we will investigate next week). High schools are a very important decision since it will determine their experience during these formative years between 14-18 years old but also potential college choices. 

“Popularity as a living destination” drives demand, home value appreciation, and strong growth in rental income. 

Schools with the highest SAT/ACT scores

– Public: Lynbrook High School, San Jose

– Avg SAT 1450 / ACT 33

– Private: The Nueva School in Hillsborough & Basis Independent in San Jose

– Avg SAT 1510 / ACT 34 for both

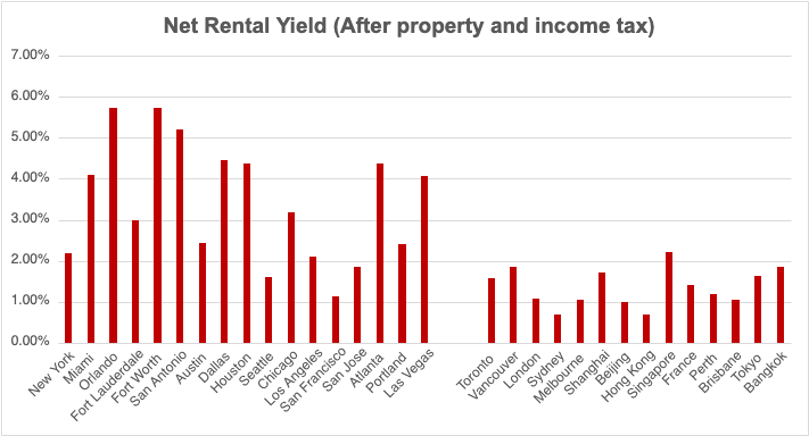
Household Income, Home Prices, and Rental Yield

We also look at the Median Household Income, Average Home Prices, and Rental yield in each city. When moving to a new city, aside from the quality of education, most will look at how expensive it will be to live there, own a home, and potential rental income potential. 

It’s probably no surprise cities like Palo Alto, San Diego, San Jose, Los Angeles, and others will have higher home prices, but we also look at a rough gauge of affordability which is a “Home Price to Income Ratio,” which tends to be where most immigrant buyers choose as their base.

Cities with the highest Median Income

– $250,000+ per annum income

– Cities: Piedmont, Hillsborough, Los Altos

– Neighbouring schools: Piedmont High School, Los Altos High

Cities with the highest Home Prices

– $2,000,000+ home price

– Cities: Piedmont, Palo Alto, Hillsborough, Ross, Atherton, Los Alto, Saratoga, San Marino

– Neighbouring schools: Piedmont High School, Los Altos High, Palo Alto High, Henry Gunn, Aragon High, Nueva School, Crystal Springs Uplands, The Branson School, Menlo High, Pinewood School, San Marino High

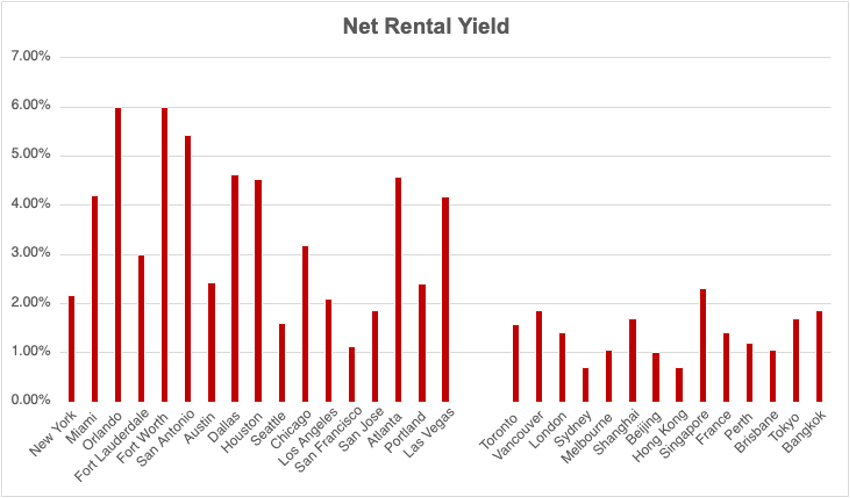
Highest Rental Yield

>5% gross yield: Riverside
>4% gross yield: Lo Jolla, San Diego, San Jose, Fresno, Irvine, San Clarita

– Neighbouring schools: Riverside STEM Academy, Canyon Crest Academy, Torrey Pines High, Westview High, Del Norte High, The Bishops School, La Jolla Country Day School, Francis Parker School, The Harder School, Basis Independent, Bellamine College Prep, Notre Dame High, University High Fresno, University High Irvine, Woodbridge High, Arnold Beckham High, TVT Community Day School, Academy of the Canyons

America Mortgage Concierge Program

We launched this free service last month to connect potential home buyers with our approved panel of realtors in each major U.S. city, which only focuses on overseas buyers. If you would like to learn more, please contact [email protected].

Our surprise guests!

At the end of August, we will be hosting a webinar with our California partner, who will present a “Guide to California Real Estate” along with a panel of the top realtors in Los Angeles, Orange County, and Bay Area to give you a real “on the ground”feel for all the points we discussed above and more.   

Stay tuned…this is going to be amazing! 

Public Schools - Guide to California Real Estate
Private School - Guide to California Real Estate

Sources: Niche, City-Data, US News, OECD data, US Census Bureau and respective school websites

Making a case for U.S. Residential Property Investment: “Let’s Look Under the Hood”

U.S. Residential Property Investment

Making a case for U.S. Residential Property Investment

“Let’s Look Under the Hood”

In the previous 2 weeks, we have discussed U.S. real estate investment’s relative affordability and income potential.

In this week’s Deep Dive, we will look at what the Key Drivers of Property Prices are and make an argument on which U.S. cities represent the best projects for future price appreciation.

The utility of owning a home is greater than any other possession – a roof over your head, it provides a sense of security for present and future generations, the sense of incredible accomplishment that “I have MADE IT in life,” and the list goes on.

However, as an investment, we need to think about its ability to produce income (dividends/rental income, etc.) and future price appreciation.

We start this discussion by digging into what factors drove property prices in the past, what ‘new’ factors exist today, and (drumroll….) we will try to take a stab at where they will be in the future.

We will also introduce a new proprietary index: AM Job Prospect Index

First, what drives property values up?

This is a vast topic that can get very granular – see below for a snapshot of a 2019 article written by the New York Fed about Forecasting Home Prices.

Forecasting Home Prices Example

But we will try to keep it simple.

Liquidity is plain and simple. The world has seen an unprecedented fiscal stimulus and monetary easing over the past 20 years.

A commonly accepted money base is M2 (Money in circulation, checking deposits, and savings deposits less than $100K).

Let’s look at M2 money supply over the past 10 years. You can see the amount the U.S. has grown its money base dwarfs any other country, and in fact, it is 4x the growth rate of the U.K. In absolute terms, the current M2 supply in the U.S. is almost twice that in Japan.

M2 Money Supply Over The Past 10 Years

Now that we have identified the global macro drivers, we can look into where the money is flowing into – specifically real estate and, more importantly, why.

It’s not surprising that the top 5 states in terms are GDP are:

CaliforniaTexasNew YorkFloridaIllinois

This is consistent with our most popular destinations for real estate investments (see below).

Within this context, we take another cut at the data and look at which cities in those states represent the highest contributors to the overall national economy:

Here are the cities with over 2% contribution to U.S. GDP:

New York City (8%!)MiamiFort LauderdaleFort WorthDallasHouston
SeattleChicagoLos AngelesSan FranciscoAtlanta

Now we look at cities with the highest GDP growth rates (over 1% y-o-y growth 2018-2019):

SeattleLos AngelesSan FranciscoSan Jose
AustinSan AntonioPortland

You can see that these cities naturally are attractive given the size of the economy; hence the probability of finding meaningful employment is higher. Now, the list likely looks much different 2020-2021, which I’m guessing will magnify the growth potential in the Texas cities even more!

Next, we will look at why these cities.

We have identified 3 main factors that raise the demand for properties in an area – 1) Economic prospects, 2) Gentrification 3) The China Effect

1) Economic prospects

AM Job Prospect Index

Our multifactor algorithm includes factors like the number of big companies moving to these cities, market capitalization of the new companies, new headquarter size, etc.

Using our “AM Job Prospect Index, in general, job prospects of U.S. cities appear to be better than other global cities. The average job prospect index for the U.S. is 70, but only 30 for other cities (the higher, the better). In the U.S., cities with the best job prospects are Austin, Dallas, Miami, Los Angeles. Austin, TX specifically, has the highest value as numerous big companies are setting up headquarters there– Tesla, Google, Amazon, SpaceX are just a few. Tesla’s new manufacturing plant in Austin alone will hire more than 10,000 through 2022. We can expect plenty of people to move to these cities, meaning increased demand and elevated home prices in these areas.

Job Growth Prospect Index

2) Gentrification

Gentrification is the process of changing the character of a neighbourhood through the influx of more affluent residents and businesses. When wealthier residents move into a neighbourhood, they often renovate homes, making them more aesthetically appealing and equipped with better facilities, which increases the value of the property. The addition of new and more “hip” businesses in the city also aids in job creation and can attract more people, increasing the demand and prices of homes.

According to the NCRC Research report, taking into account the number of neighborhoods gentrified and the intensity of gentrification, New York, Los Angeles, San Francisco, Houston, Austin, Miami are the most gentrified cities in the U.S. (arranged in order). Therefore, we can expect home prices to appreciate in these cities.

3) The China Effect

Instead of the usual demographic factors like immigration, we’ll look at the percentage of the population who are Chinese. Why do we do so? China has experienced rapid growth in recent years, and its people have gained a significant amount of wealth. It’s no surprise that according to the National Association of Realtors annual report of International Buyers of U.S. residential real estate, China was ranked #1 for the past 5 years.

Foreign Buyer of U.S. Properties (By Country)

Excluding predominantly Chinese cities, we see that the average percentage of Chinese the U.S. cities (9.85%) is higher than those in other major cities (8.25%). Thus, we can expect Chinese investors to be more inclined towards U.S. cities, demanding more houses and driving up prices in U.S. cities more than other cities. They will typically choose areas with a significant Chinese population as it offers a sense of familiarity. U.S. cities with the highest percentage of Chinese population are Los Angeles, San Francisco, New York, Seattle.

Percentage of Chinese

Based on the abovementioned factors and looking at the “top performers” in each category, prices will likely appreciate the most in Texas, Los Angeles, Miami. This is also in line with the price appreciation data provided by Case-Shiller Home Price Index and Zillow. Prices appreciated by 35.07% in Austin last year!

Prices Appreciated Graph

In summary, the conclusions in this report are consistent with our previous 2 reports. There is a tremendous amount of value in the Texas cities, with its abundant jobs, high wage growth, low taxes, easy of travel, strong ethnic mix, and the list goes on.

New York will always have a premium, and Los Angeles and San Francisco will always have specific attributes which make them unique.

HOWEVER, the high cost of living, home prices, and state taxes are quickly driving residents to other states. Almost every metric we see supports this argument. Gentrification in the U.S. is real and is happening much faster than we can imagine. Just look at new home sales from the largest home building company Lennar. They cannot sell enough homes, and it’s the Gentrification Effect we discuss above.

One area that the U.S. has lagged behind its low-cost international peers over the past 10 years is the vocational workforce – smartphone manufacturing, assembly, etc. This was a growth engine in the 80s before the Japanese began their auto manufacturing dominance. But slowly, the U.S. economy retooled and prospered again. Then in the early 2000s, the steel industry lost millions of jobs to low-cost manufacturers overseas, and those jobs have not returned.

The current trend of technology companies moving major offices inwards (See Texas) not only helps the local economies but it reflects a bigger theme – vocational employment. It may not be assembling smartphones, but it will be something else – smart cars, smart cities, smart grids, distribution centers, cloud kitchens, drone deliveries, and so on. Technology is clearly the growth driver going forward, and if you are thinking of real estate as an investment, you should look at states that offer this type of value. Right now, it is clearly Texas, and I suspect there is still more room to go here.

In next week’s Deep Dive, we will be bringing in a U.S. Tax Accountant who focuses specifically on U.S. Expats to explain how the tax regime on owning U.S. property is not as bad as you think and, in fact, could be the easiest and most flexible in the world!

Keep your eyes peeled and subscribe to our newsletter, so you don’t miss out! www.americamortgages.com

Making a case for U.S. Residential Property Investment: “It’s not Apples to Apples”

Residential Real Estate Investment US

Making a case for U.S. Residential Property Investment

“It’s not Apples to Apples”

As you may recall, last week, we looked at the affordability between popular U.S. investment destinations compared to major cities in the world. We argued that the U.S. offered the best “entry price” for real estate investments on absolute terms and when adjusted for affordability.

This week in Part 2 of our Deep Dive Series, we look at the Relative Income Potential of the popular U.S. investment destinations compared to major cities in the world.

Investing in residential properties or buying-to-let is a form of a business, and as a business owner, making a profit is of priority. A common metric that we use to measure the profitability of a real estate investment is rental yield. Net rental yield measures the profit you generate each year from your investment as a percentage of its value.

Same as what we did last week, we shall compare data sets from 2 sample groups:

1. Major global cities:

TorontoVancouverLondonSydneyMelbourne
ShanghaiBeijingHong KongSingapore

2. Top U.S. residential real estate investment destinations:

New York, NYMiami, FLOrlando, FLFt Lauderdale, FLFt Worth, TX
San Antonio, TXAustin, TXDallas, TXHouston, TXSeattle, WA
Chicago, ILLos Angeles, CASan Fran, CASan Jose, CAAtlanta, GA
Portland, ORLas Vegas, NV

On average, the net rental yield of popular U.S. real estate investment destinations is 3.49%, much higher than that of other global cities – 1.39%. This means that on average, for a property that costs USD 500 000, you can earn approximately USD 17,450 if this property is in the U.S. and only USD 6,950 if this property is in other global cities. This is after accounting for property taxes. We see that investing in the U.S. can earn you 2.5 times the income you will earn in other cities!

In the following chart, you will see the disparity in the profit flow more clearly.

Net Rental Yield Chart

Now, if we look at the net rental yield that takes into account both local property and rental income tax as part of the costs, we can see that the results are similar. U.S. destinations, on average, have a much higher yield than other global cities (3.40% vs. 1.36%).

Note: Even after considering income tax, investing in the U.S. can still earn you 2.5 times the income you will earn in other cities.

Myth Buster – The common misconception that the U.S. tax regime makes investing difficult and not feasible is unfounded. Even adjusting for taxes, U.S. residential real estate is superior investment.

Net Rental Yield (After Property and Income Tax)

To further strengthen our point that the income potential of U.S. cities is much higher than other global cities, including your home cities, take a look at the table below. If you live in the cities stated in the row, you should definitely not buy-to-let in the cities highlighted in red as the income potential in those cities is worse than your home. Instead, it would be best to invest in the cities highlighted in yellow, where yield is much higher.

Net Rental Yield differences between Major Global Cities and U.S. Residential Real Estate Investment Destinations

Net Rental Yield Differences

Let someone else pay for your mortgage.

To make things better, in some U.S. cities, you can even pay off a sizeable portion of your mortgage loan with your post-tax rental income. Using the AM debt coverage ratio, we see that in cities such as Orlando and Fort Worth, without considering other maintenance costs of your home, your annual post-tax rental income can cover all of your annual mortgage payment (with some to spare). This is rare in other global cities. In Hong Kong, annual post-tax rental income can only cover 17% of the yearly mortgage payment.

The following diagram shows the debt coverage ratio comparison (the higher, the better).

Debt Coverage

Solely based on net rental yield, you should always consider Orlando, Fort Worth, San Antonio, and almost never San Francisco. It is interesting to see some overlap with last week’s affordability rankings, where Fort Worth and San Antonio were at the top and San Francisco at the bottom.

Just like affordability, rental yield is also just another aspect of property investment. It is important to consider other factors too – growth potential of the city, capital gains, future price appreciations – which we will discuss in our next report.

To summarize, we see that U.S. real estate properties are outperforming other major global cities in terms of affordability and income potential.

Next week, we will get an even bigger picture by understanding the factors that drive property value growth and why these factors will affect U.S. real estate investments more than other major global cities. You won’t want to miss out!

Stay tuned for next week’s continuation of our Deep Dive series. Email Us

Making a case for U.S. Residential Property Investment – “Cheap as Chips”

America Mortgages - U.S. Residential Property Investment

America Mortgages introduces….

In our never-ending crusade to acquaint and educate the world of the investment opportunities in U.S. residential real estate and the ease of securing financing, we launch “The Deep Dive Series.” We investigate major themes, dispel major misconceptions in the U.S. real estate market, and use data to confirm our thesis.

Over the next 5 weeks, we will publish a series of reports on the following theme:

Making a case for U.S. Residential Property Investment.

  • Week 1 – “Cheap as Chips”
  • We compare at the relative affordability of the major U.S. real estate investment cities vs. major global cities.
  • Week 2 – “It’s not Apples to Apples.”
  • We look at the relative income potential of U.S. real estate investment cities vs. major global cities.
  • Week 3 – “Let’s Look Under the Hood”
  • We investigate what drives property prices and why these factors are more constructive in the major U.S. real estate investment cities vs. major global cities.
  • Week 4 – “Its Bark is Worse Than Its Bite”
  • We dispel the misconception that owning U.S. property is burdened with taxes and complications when it’s probably the easiest and most flexible in the world.
  • Week 5 – “Bringing Everyone to the Table”
  • In the final report, we expand on the above topics and combine them into a comprehensive mosaic to be published and distributed. 

“Cheap as Chips”

This week is Part 1 of our Deep Dive Series where we look at the Relative Affordability of the major U.S. investment destinations compared to major cities in the world.

When investors look at where they should buy real estate, most will typically choose where they live. This is rational because you know the market, the financing landscape and can physically see the property at any time.

However, if the assumption is to earn the highest risk-adjusted return for an investment property, then it would be irrational to not explore all real estate investment opportunities that could offer you the highest return.

Of course, as a primary home, there are other considerations to motivate a homeowner, such as not worrying about a “roof over your head.”

This is particularly true in Asia and ingrained in the culture, but in many countries like Germany and France, homeownership hovers around 50-60% vs. say Singapore, where homeownership is over 90% (admittedly the highest in the world).

When buying anything, you look at the absolute price of the asset and the associated costs (which include mortgage rates, stamp duties, taxes, etc.), what you can afford, adjusted for the risk (to include research time), its income potential and lastly what you think the asset will be priced in the future.

Let’s start with the price and cost of U.S. real estate vs. major global cities. 

We compare datasets from 2 sample groups.

1. Major global cities:

TorontoVancouverLondonSydneyMelbourne
ShanghaiBeijingHong KongSingapore

2. Top U.S. residential real estate investment destinations:

New York NYMiami FLOrlando FLFt Lauderdale FLFt Worth TX
San Antonio TXAustin TXDallas TXHouston TXSeattle WA
Chicago ILLos Angeles CASan Fran CASan Jose CAAtlanta GA
Portland ORLas Vegas NV

If we look at the major global cities where majority of our clients live, we will find that the affordability of a 1500 sq. ft house is really low.

AM Affordability Index*

*Our proprietary index includes factors such as, taxes, pension contributions, debt repayment, inflation, currency and others.

Using our proprietary AM Index, 0 represents a house that is very unaffordable and 100 represents a house that is very affordable.  Affordability only ranges from 0 – 24 in our client’s home cities.

Now, looking at the data for popular investment destinations in the U.S. for real estate investors. We see that the average affordability is drastically higher. This is particularly so for San Antonio, Chicago, and Fort Worth.

For example, if you live and work in Vancouver and earn the median income, the affordability index of 1500 sq. ft house in your city is at a meagre 12. However, the affordability index of a same-sized house in Fort Worth is at a whopping 94!

Read – if you live in Vancouver, buying a Fort Worth Texas investment property is 8x “more affordable” than back home!

You will see this graphically in the following charts, and the results are very clear and obvious.

Solely based on affordability, when purchasing property for investment income, you should always consider Chicago, San Antonio, Fort Worth, and almost never San Francisco.

Now, we know there are many other considerations when buying property besides just being cheap and affordable – like historical price appreciation vs. future price expectations, net rental yield, ease of securing financing, friction costs of doing the research – all of which we will discuss in our upcoming reports.

In summary, when deciding where to invest next, it’s best to get out of your comfort zone and be open-minded to the opportunities.

There are other cities in the world that you can consider aside from your home country, but we argue the best cities for real estate investments are in the U.S.

Hopefully, Part 1 of our Deep Dive Series has showed you that U.S. properties are more affordable that you think. In fact, they could be up to twelve times more affordable than your own city, e.g. Hong Kong residents buying in Chicago!

Next week, we will illustrate the net income potential of U.S. real estate investment cities vs. major global cities, i.e. how much you can earn from renting after financing costs… the results will shock you!

Still not convinced?

Supporting Charts

Price Differences between Major Global Cites and U.S. Residential Real Estate Investment Destinations:

Supporting Charts - Price Differences between
Toronto Residents Chart
Vancouver Residents Chart
London Residents Chart
Sydney Residents Chart
Melbourne Residents Chart
Shanghai Residents Chart
Beijing Residents Chart
Hong Kong Residents Chart
Singapore Residents Chart

Stay tuned for next week!

The Roaring 2020s?

mortgage specialist

The “Roaring 20’s” is often considered as one of the most prosperous times in the West. WWI had just ended, and the housing market’s growth, the development of infrastructure, telephone networks, automobiles, etc., was the centerpiece of growth. America’s wealth more than doubled in the years between 1920 and ’29 with most of the wealth invested into finance and industry but there was enough trickle-down to lower-income earners to help buoy a new consumer culture.

Doesn’t this sound familiar?

In 2020, FAANG stocks (our version of industrial stocks in 1920s) doubled as well!

FAANG stocks Graph

Meanwhile, as the world heads towards being incrementally more vaccinated, we are seeing inflation expectations rise, the first wage growth in over a decade, and a potential $3T infrastructure plan in the U.S. which draws some comparisons to FDR’s The New Deal.

Personally, I find it remarkable how the global macro narrative has shifted 180-degree only one year out from the start of a global pandemic, and also not far from when the discussions among leading economists were ‘when’ deflation would happen, not if. Now consensus, in under 12 months, has gone from deflation to inflation.

If you are looking for evidence that inflation is back, look no further than housing prices. Knight Frank reports that worldwide home prices rose 5.6% in 2020, and CoreLogic says U.S. home prices increased 10.4% year-on-year in February 2021, the highest in 15 years!

Taking some data points from Knight Frank’s survey, look at the annual % change in home prices in the major cities that Global Mortgage Group offers mortgages in.

Can you guess which city had the highest growth in the U.S., U.K., France, Canada, Australia, and Singapore? Read here to find the answer!

U.S.
Phoenix, California+14%
Seattle, Washington+13%
Los Angeles, California +10%
New York City, New York+10%
Atlanta, Georgia+8.9%
Dallas, Texas+8.4%
Miami, Florida+9.2%
Switzerland
Geneva, Switzerland+7%
France
Lyon, France+8.9%
Paris, France+7.7%
Australia
Sydney, Australia+4.5%
Brisbane, Australia+4.2%
Melbourne, Australia +3.6%
U.K.
Manchester, UK+8.7%
London, UK+4.3%
Canada
Montreal, Canada+15%
Toronto, Canada+10%
Vancouver, Canada+7%
Singapore
Singapore+2.2%

For more information, please contact [email protected].

Sources: World Property Journal, High Finance, History.com