
America Mortgages introduces….
In our never-ending crusade to acquaint and educate the world of the investment opportunities in U.S. residential real estate and the ease of securing financing, we launch “The Deep Dive Series.” We investigate major themes, dispel major misconceptions in the U.S. real estate market, and use data to confirm our thesis.
Over the next 5 weeks, we will publish a series of reports on the following theme:
Making a case for U.S. Residential Property Investment.
- Week 1 – “Cheap as Chips”
- We compare at the relative affordability of the major U.S. real estate investment cities vs. major global cities.
- Week 2 – “It’s not Apples to Apples.”
- We look at the relative income potential of U.S. real estate investment cities vs. major global cities.
- Week 3 – “Let’s Look Under the Hood”
- We investigate what drives property prices and why these factors are more constructive in the major U.S. real estate investment cities vs. major global cities.
“Cheap as Chips”
This week is Part 1 of our Deep Dive Series where we look at the Relative Affordability of the major U.S. investment destinations compared to major cities in the world.
When investors look at where they should buy real estate, most will typically choose where they live. This is rational because you know the market, the financing landscape and can physically see the property at any time.
However, if the assumption is to earn the highest risk-adjusted return for an investment property, then it would be irrational to not explore all real estate investment opportunities that could offer you the highest return.
Of course, as a primary home, there are other considerations to motivate a homeowner, such as not worrying about a “roof over your head.”
This is particularly true in Asia and ingrained in the culture, but in many countries like Germany and France, homeownership hovers around 50-60% vs. say Singapore, where homeownership is over 90% (admittedly the highest in the world).
When buying anything, you look at the absolute price of the asset and the associated costs (which include mortgage rates, stamp duties, taxes, etc.), what you can afford, adjusted for the risk (to include research time), its income potential and lastly what you think the asset will be priced in the future.
Let’s start with the price and cost of U.S. real estate vs. major global cities.
We compare datasets from 2 sample groups.
1. Major global cities:
| Toronto | Vancouver | London | Sydney | Melbourne |
| Shanghai | Beijing | Hong Kong | Singapore | |
2. Top U.S. residential real estate investment destinations:
| New York NY | Miami FL | Orlando FL | Ft Lauderdale FL | Ft Worth TX |
| San Antonio TX | Austin TX | Dallas TX | Houston TX | Seattle WA |
| Chicago IL | Los Angeles CA | San Fran CA | San Jose CA | Atlanta GA |
| Portland OR | Las Vegas NV | |||
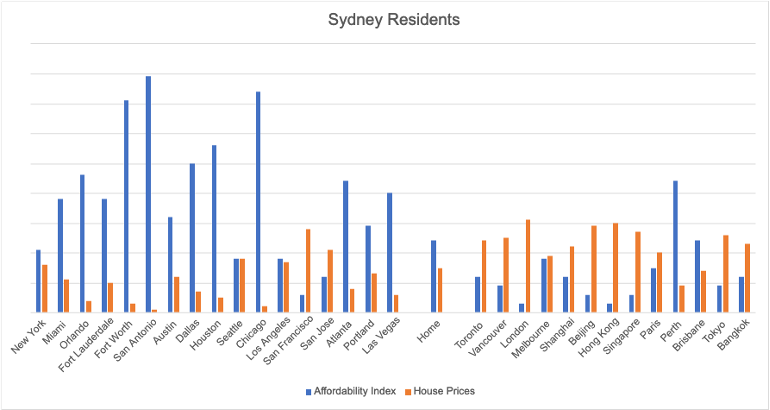
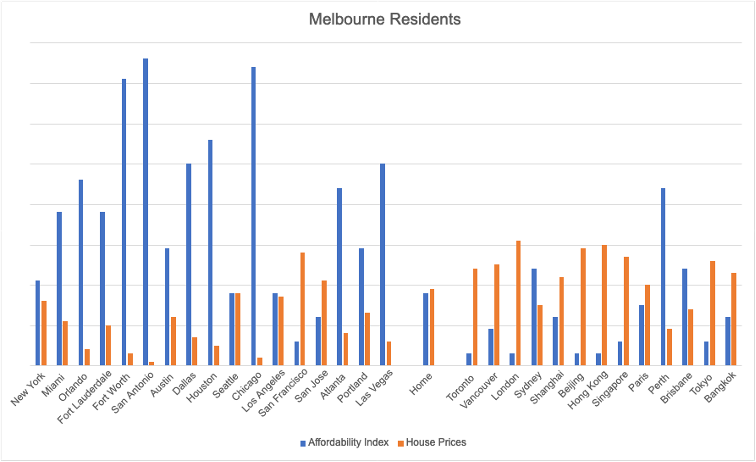
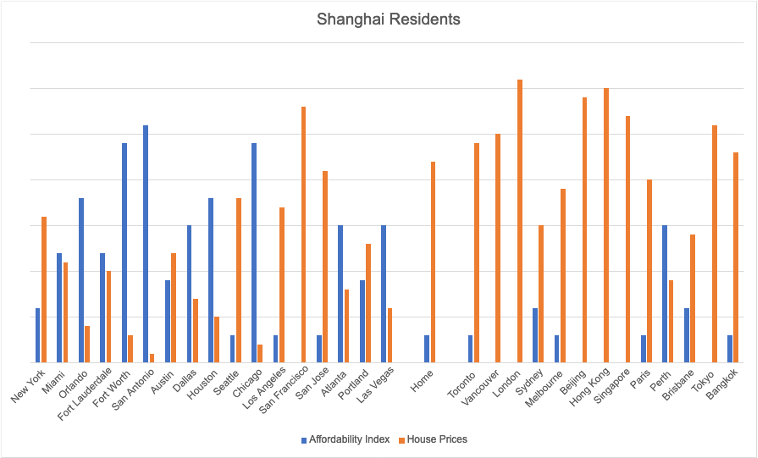
If we look at the major global cities where majority of our clients live, we will find that the affordability of a 1500 sq. ft house is really low.
AM Affordability Index*
*Our proprietary index includes factors such as, taxes, pension contributions, debt repayment, inflation, currency and others.
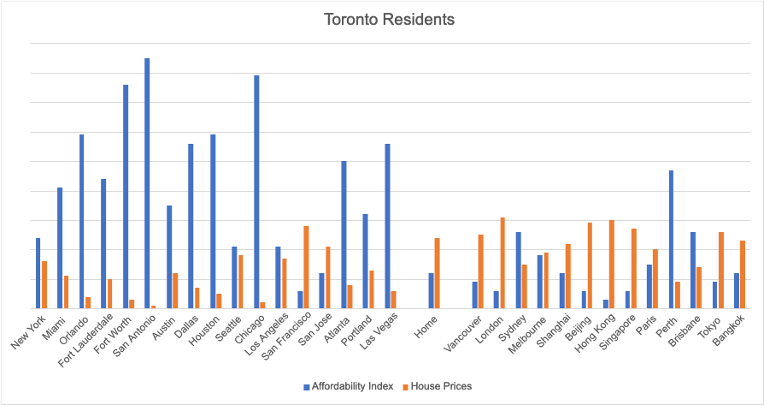
Using our proprietary AM Index, 0 represents a house that is very unaffordable and 100 represents a house that is very affordable. Affordability only ranges from 0 – 24 in our client’s home cities.
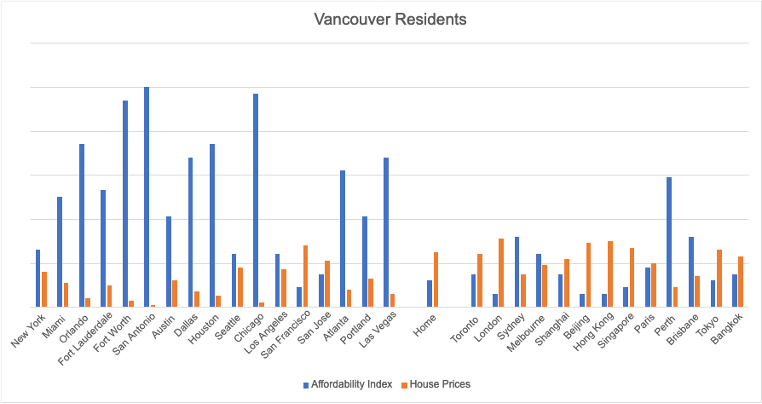
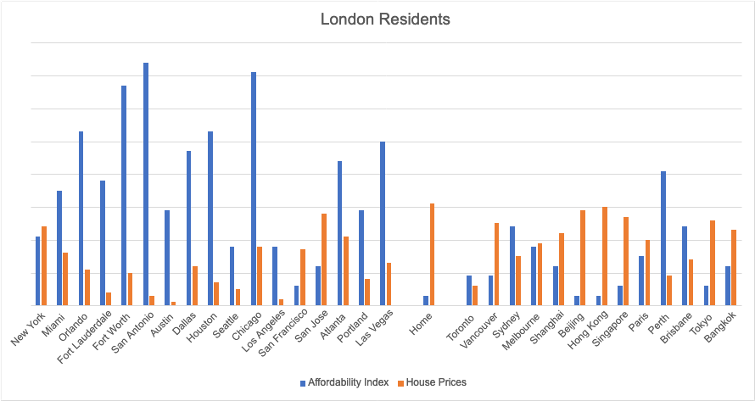
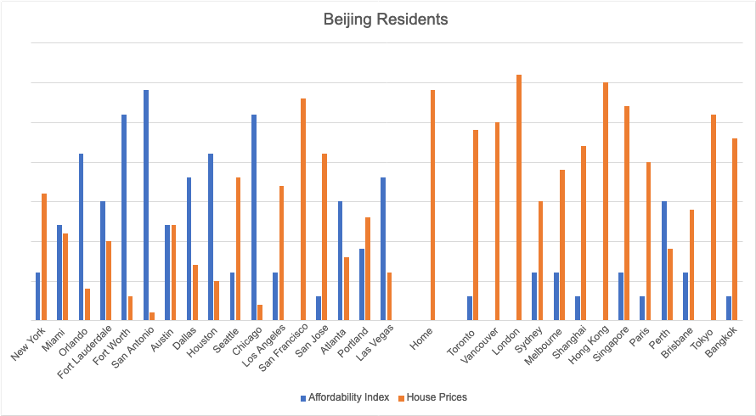
Now, looking at the data for popular investment destinations in the U.S. for real estate investors. We see that the average affordability is drastically higher. This is particularly so for San Antonio, Chicago, and Fort Worth.
For example, if you live and work in Vancouver and earn the median income, the affordability index of 1500 sq. ft house in your city is at a meagre 12. However, the affordability index of a same-sized house in Fort Worth is at a whopping 94!
Read – if you live in Vancouver, buying a Fort Worth Texas investment property is 8x “more affordable” than back home!
You will see this graphically in the following charts, and the results are very clear and obvious.
Solely based on affordability, when purchasing property for investment income, you should always consider Chicago, San Antonio, Fort Worth, and almost never San Francisco.
Now, we know there are many other considerations when buying property besides just being cheap and affordable – like historical price appreciation vs. future price expectations, net rental yield, ease of securing financing, friction costs of doing the research – all of which we will discuss in our upcoming reports.
In summary, when deciding where to invest next, it’s best to get out of your comfort zone and be open-minded to the opportunities.
There are other cities in the world that you can consider aside from your home country, but we argue the best cities for real estate investments are in the U.S.
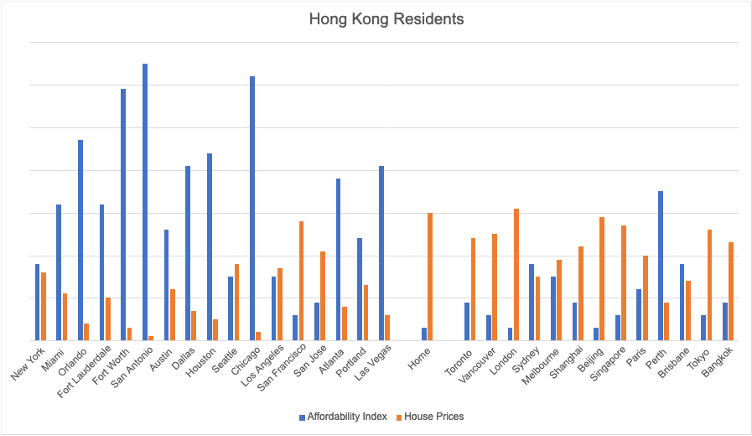
Hopefully, Part 1 of our Deep Dive Series has showed you that U.S. properties are more affordable that you think. In fact, they could be up to twelve times more affordable than your own city, e.g. Hong Kong residents buying in Chicago!
Next week, we will illustrate the net income potential of U.S. real estate investment cities vs. major global cities, i.e. how much you can earn from renting after financing costs… the results will shock you!
Still not convinced?
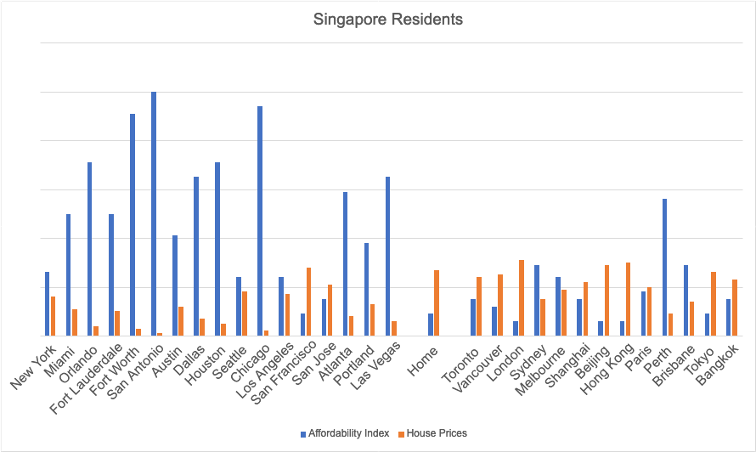
Supporting Charts
Price Differences between Major Global Cites and U.S. Residential Real Estate Investment Destinations:
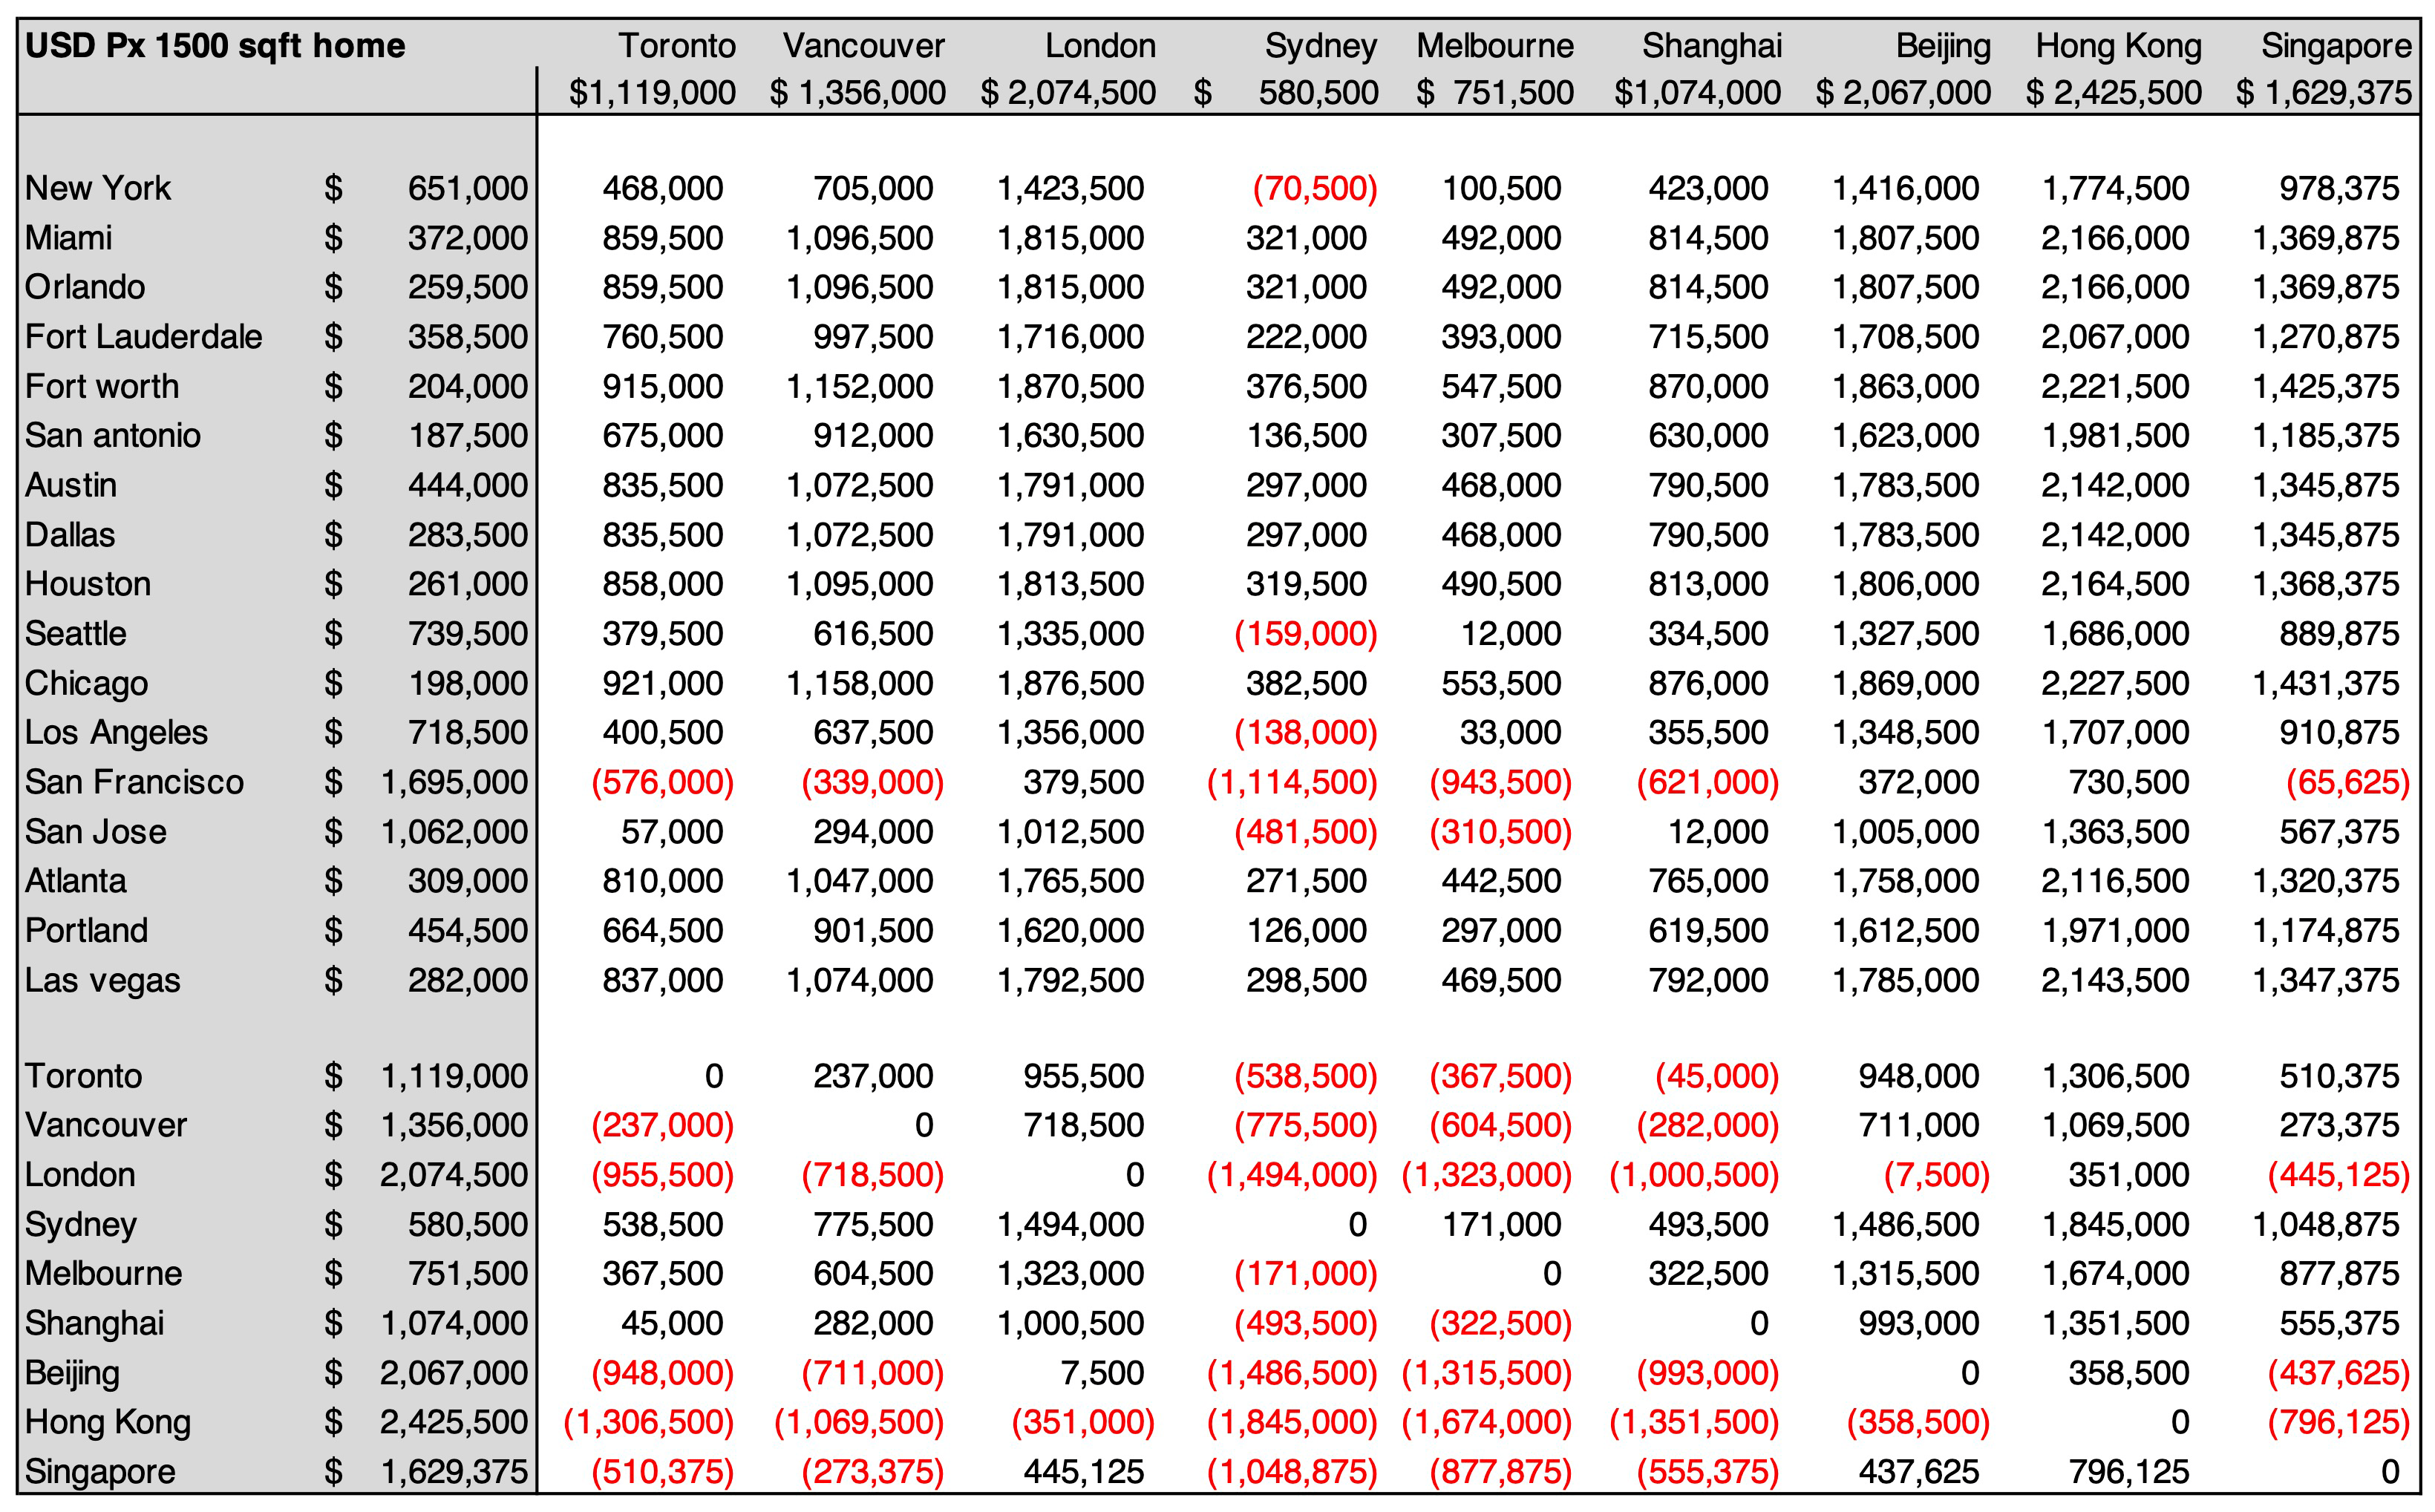
Stay tuned for next week!